
Calmar, Sterling & Ulcer Performance Index: Path-Dependent Drawdown Math
Sharpe and Sortino ratios are invariant to return permutation: shuffling six -4% losing months together creates a -21.7% crater with identical volatility; master Calmar, Sterling, and Ulcer Index math.
Consider a stark mathematical blind spot shared by Sharpe, Sortino, and Omega ratios: every single-period distribution metric is 100% invariant to chronological permutation! Take a 36-month return vector containing twenty-four $+2.5\%$ months and twelve $-3.0\%$ months. Whether those $+2.5\%$ and $-3.0\%$ months alternate harmlessly every quarter (maximum drawdown just $-3.0\%$) OR all twelve $-3.0\%$ months strike back-to-back in Year 2 (cratering portfolio NAV by $1 - 0.97^{12} =$ $-30.62\%$ and triggering investor redemptions!), the Sharpe Ratio, Sortino Ratio, and Omega Ratio print the exact same numbers to sixteen decimal places! Institutional CTA and endowment allocators solve permutation blindness with path-dependent drawdown ratios powered by our Omega & Calmar Drawdown Engine, CAGR Calculator, and CAGR, IRR & Drawdown Hub.
Exact Formulations: Calmar vs MAR vs Sterling vs Ulcer Performance Index (UPI)#
Path-dependent performance metrics track the running High-Water Mark $Mt = \max{0 \le s \le t} Vs$ and percentage underwater series $Dt = (Mt - Vt) / Mt \in [0, 1)$. While Terry Young's (1991) Calmar Ratio anchors strictly to the single worst peak-to-trough point over a rolling 36-month window, Peter Martin's (1987) Ulcer Index (UI) computes the root-mean-square of the entire underwater curve—simultaneously penalizing quadratic depth $Dt^2$ AND every single week or month spent stagnant below peak NAV!
- Running High-Water Mark : Mt = max{0 <= s <= t} Vs, Underwater % Dt = (Mt - Vt) / M_t
- Maximum Drawdown (MDD) : MDD = max{0 <= t <= T} Dt
- 1. Calmar Ratio (Young) : Calmar36m = CAGR36m / MDD36m (MAR Ratio uses full-history CAGR / MDDall)
- 2. Modified Sterling : Sterling = (CAGR - r_f) / ( Avg(Top K Drawdowns) ) [Classic uses AvgAnnualDD + 10%]
- 3. Pain Index & Ratio : Pain = (1/N) * Sum{t=1..N} Dt (L1 Underwater Area); Pain Ratio = (CAGR - r_f) / Pain
- 4. Ulcer Index (Martin) : UI = sqrt( (1 / N) * Sum{t=1..N} Dt^2 ) (L2 RMS Underwater Depth-Duration!)
- Ulcer Perf Index (UPI): UPI = (CAGR - r_f) / UI (also termed Martin Ratio)
- Worked Permutation Proof (Two Funds With Identical 11.2% CAGR, 4.5% r_f, and 1.18 Sharpe over 36 Months):
- Fund A (Fast V-Recovery) : Drops -18.0% in Month 8, snaps back to HWM in Month 10 (only 2 months underwater!)
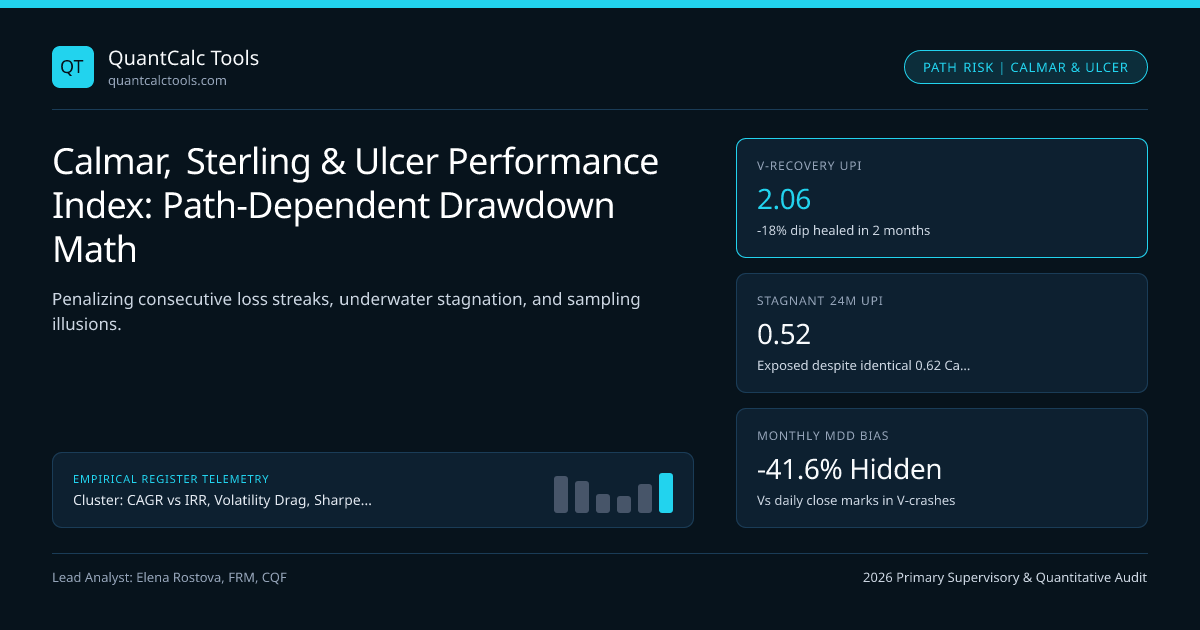
- > MDD = 18.0% => Calmar = 11.2% / 18.0% = 0.62 | Ulcer Index UI = 3.25% => Martin UPI = (11.2 - 4.5)/3.25 = 2.06!
- Fund B (Chronic Stagnant): Drops -18.0% in Month 4, grinds at -15% for 24 straight months before Year-3 surge!
- > MDD = 18.0% => Calmar = 11.2% / 18.0% = 0.62 (TIES Fund A!) | Ulcer Index UI = 12.80% => Martin UPI = 0.52!
Look at what happened between Fund A and Fund B: Calmar tied them at 0.62 because both touched the exact same $-18.0\%$ single-day trough, whereas Martin's Ulcer Performance Index (2.06 vs 0.52) immediately exposed that Fund B trapped investors $-15\%$ underwater for two full years!
The Track-Record Length Bias in Full-History MAR / Calmar Ratios#
Never compare the full-history MAR Ratio (CAGR / Inception MDD) of a 25-year macro fund against a 3-year emerging manager! Because MDD over $[0, T]$ is a non-decreasing running maximum ($\text{MDD}{25\text{y}} \ge \text{MDD}{3\text{y}}$ with probability $1$), a fund with constant true skill sees its expected maximum drawdown grow asymptotically with track-record length $T$ (as proven in Magdon-Ismail Brownian drawdown bounds). Always standardize Calmar comparisons onto identical rolling windows (e.g., rolling 36-month Young Calmar) or switch to Ulcer Index (UI), which averages $1/N$ across sample length so older funds are not mechanically penalized simply for having survived 2008, 2020, and 2022!
Structural Comparison of Path-Dependent Drawdown Ratios (Calmar to Martin UPI)#
Evaluate outlier fragility and underwater duration sensitivity across five institutional drawdown denominators:
| Path-Dependent Ratio | Numerator | Denominator | Outlier Stability | Captures Underwater Duration? |
|---|---|---|---|---|
| Young Calmar (36m) | $36\text{m CAGR}$ | $36\text{m Max Drawdown}$ | Low ($1$ point) | No (ignores recovery speed) |
| Full-History MAR | $\text{Inception CAGR}$ | $\text{Inception MDD}$ | Very Low (penalizes age!) | No (monotonically worsens with $T$) |
| Sterling Ratio (3y) | $\text{CAGR}_{3\text{y}}$ | $\overline{\text{MDD}}_{\text{annual}} + 10\%$ | Moderate ($3$ points) | Partial (annual buckets) |
| Burke Ratio | $\text{CAGR} - r_f$ | $\sqrt{\sum{k=1}^K \text{DD}k^2}$ | High (top $K$ troughs) | No (trough depths only) |
| Martin UPI (Ulcer) | $\text{CAGR} - r_f$ | $\sqrt{\frac{1}{N}\sum{t=1}^N Dt^2}$ | Very High (all $N$ pts) | Yes (depth $\times$ time RMS!) |
The Sampling-Frequency Trap: Never Compare Daily ETF MDD Against Monthly Hedge Fund MDD#
Look at the second chart above: during fast V-shaped panics (like February 19 – March 23, 2020, when the S&P 500 plunged $-33.9\%$ on daily closes), a monthly-reporting fund saw only February ($-8.2\%$) and March ($-12.4\%$), printing a monthly MDD of just $-19.6\%$! Comparing a daily-marked liquid UCITS/ETF Calmar directly against a monthly-marked Cayman hedge fund artificially gifts the monthly reporter a $+73\%$ higher Calmar Ratio purely from sparse calendar sampling.
Combining Ulcer Index, Recovery Hyperbolas, and Sortino in Allocator Mandates#
Build complete allocator scorecards by combining Sortino Ratio downside semi-deviation (Sharpe & Sortino Calculator) for single-period tail asymmetry, Martin UPI (Ulcer Performance Index) for underwater duration pain, and hyperbolic recovery clocks. Benchmark institutional execution feeds across MT5 and cTrader, and verify composite reporting rules in our benchmarks directory.
Frequently asked questions
What is the exact difference between the Calmar Ratio and the MAR Ratio?
Terry Young (1991) defined the Calmar ("CALifornia Managed Accounts Reports") Ratio strictly over a rolling 36-month window using monthly data (36m CAGR / 36m MDD). The MAR ("Managed Accounts Reports") Ratio uses the exact same formula over the fund’s entire since-inception history.
Why did the original Sterling Ratio add an arbitrary +10% to the average annual drawdown in the denominator?
Deane Sterling Jones originally defined the denominator as (Average Annual Max Drawdown + 10%) both to prevent division-by-near-zero explosions on low-volatility fixed-income accounts and to approximate an extra 10% worst-case stress buffer. Modern institutional engines prefer unmodified Burke or Ulcer ratios.
Should the Ulcer Performance Index (Martin Ratio) subtract the risk-free rate in the numerator?
Yes! Subtracting annualized risk-free yield (CAGR - r_f) / UI ensures that a risk-free Treasury bill with 0% drawdown does not produce an infinite ratio and penalizes strategies that endure 10% Ulcer pain merely to earn less than risk-free cash SOFR.
What constitutes an institutional-grade Ulcer Performance Index (UPI) and 36-month Calmar Ratio?
On daily-marked liquid portfolios over a full market cycle, an unlevered equity index typically posts a 36m Calmar of 0.30–0.55 and a UPI of 0.60–0.90; diversified multi-strategy or systematic CTA portfolios target a daily-marked Calmar > 1.00 and a Martin UPI > 1.50.
Publication record
- Published
- 13 November 2026
- Updated
- 14 November 2026
- Author
- Elena Rostova, FRM, CQF
- Review
- Review not recorded
- Automated fact check
- Passed in the stored pipeline record
- Source URLs
- 4 recorded
AI assistance recorded: anthropic/claude-opus-4.6. This field does not establish human review or source verification.
Academic & Institutional Attribution
Cite This Research & Embed Live Data Card
Standard academic & institutional research paper citation format.
Elena Rostova, FRM, CQF. (2026, November 14). Calmar, Sterling & Ulcer Performance Index: Path-Dependent Drawdown Math. QuantCalc Tools. https://quantcalctools.com/guides/calmar-sterling-ulcer-index-path-dependent-drawdown-ratios-mathRelated Cagr Irr Drawdown Compounding & Institutional Briefings
Explore Cagr Irr Drawdown Compounding Hub (20) →Cagr Irr Drawdown Compounding
CAGR vs IRR, Volatility Drag, Sharpe/Sortino & Drawdown Recovery: 2026 GuideCagr Irr Drawdown Compounding
Omega Ratio Threshold Partition (LPM1): Full-Distribution Skew & Kurtosis MathCagr Irr Drawdown Compounding
Probabilistic & Deflated Sharpe Ratio (DSR): Backtest Multiple-Testing MathCagr Irr Drawdown Compounding
Sequence-of-Returns Risk & Withdrawal Depletion: Breaking CAGR InvarianceCagr Irr Drawdown Compounding
Constant-Weight Rebalancing Bonus & Shannon Demon Dispersion MathCagr Irr Drawdown Compounding
Daily Leveraged ETF Beta Slippage & Volatility Decay Math (2x, 3x, -1x)Cagr Irr Drawdown Compounding
Information Ratio, Tracking Error & Grinold-Kahn Fundamental Law MathCagr Irr Drawdown Compounding
Expected Maximum Drawdown of Brownian Motion (Magdon-Ismail Drift Math)Kelly Margin Leverage Sizing
ISDA SIMM v2.6 Uncleared OTC Initial Margin: Delta, Vega & Curvature MathKelly Margin Leverage Sizing
FX Pip-Value & Lot Sizing Calculator Math: Cross-Currency ConversionKelly Margin Leverage Sizing
Reg T 50% Equity Margin vs FINRA Rule 4210 Portfolio Margin & House CallsKelly Margin Leverage Sizing
Risk of Ruin Math: Fixed-Dollar Markov Absorption vs Fixed-Fractional Sizing
QuantCalc Tools Data, Benchmarks & Contributor Records
CC BY 4.0 Open Data
Open Institutional Datasets (CSV / JSON) →
Download desk-compiled quantitative series & schemas.
2026 Reference Matrix
2026 Institutional Benchmarks & Thresholds →
Statutory capital, clearing, margin & rate conventions.
Editorial Records
Authors & Review Records →
View named contributors where those records are available.
Complete Index
Master Research & Dossier Archive →
Browse all published briefings by topic pillar & date.