
Key-Rate Duration (KRD) Tent Functions: Partial DV01 Curve Bucketing Math
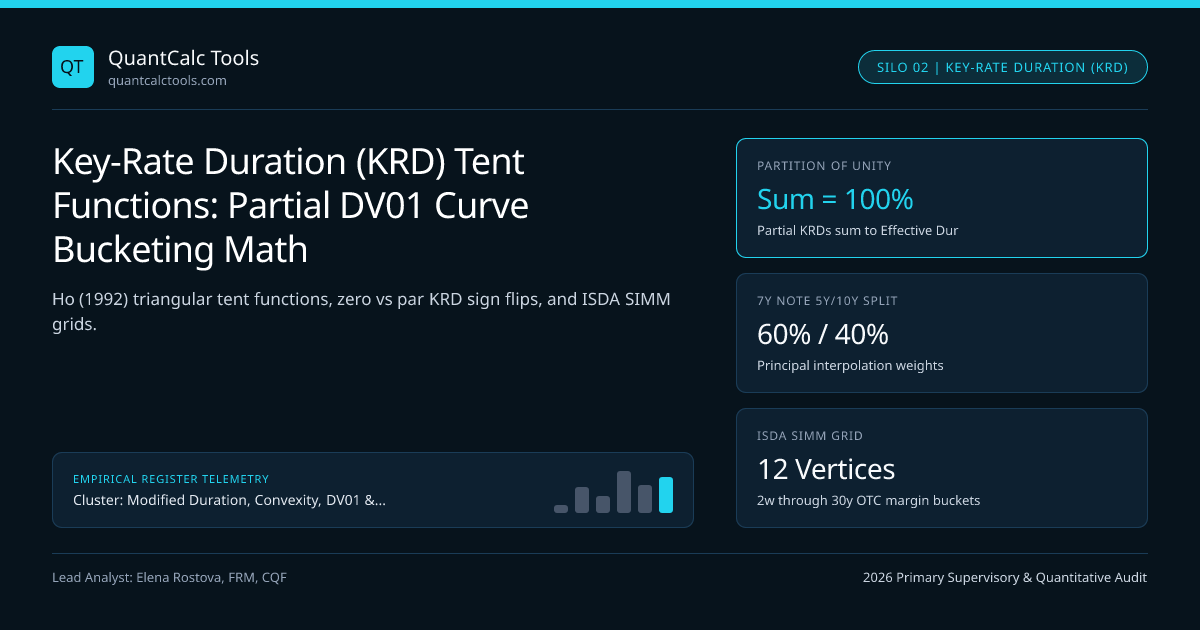
Thomas Ho’s Key-Rate Duration (KRD) partitions parallel curve risk across localized triangular zero-rate tent shocks (2Y, 5Y, 10Y, 30Y) that sum identically to total Effective Duration.
How can two bond portfolios both report an exact Modified Duration of $7.82$ years (DV01 = $78,200/bp) on Friday afternoon, yet diverge by $$2,140,000$ in PnL on Monday morning after an FOMC press conference? Because single-number parallel duration collapses a 30-dimensional yield curve into one scalar! Introduced by Thomas S. Y. Ho (1992) and standardized across institutional desks via Key Rate Duration (KRD) & Partial DV01 Yield Curve Bucketing and ISDA SIMM v2.6 interest-rate delta grids, Key-Rate Durations measure partial price sensitivity to localized piecewise-linear triangular "tent" perturbations at specific benchmark maturities ($\tau1, \dots, \taum$). Compare cash funding curves in our SOFR overnight compounding & carry calculator and ground this framework in our Modified Duration, Convexity & DV01 master guide.
Exact Mathematical Definition of Ho's Triangular Tent Basis Functions#
Select $m$ ordered key maturities on the zero-coupon spot curve, e.g., $\tau = (2\text{Y}, 5\text{Y}, 10\text{Y}, 30\text{Y})$. For an interior key rate $\tauk$ ($1 < k < m$), a $+1\text{ bp}$ shock $\Delta zk(t) = \epsilon \cdot \phik(t)$ raises the spot rate by $+\epsilon$ at $t = \tauk$, decays linearly to zero at neighboring nodes $\tau{k-1}$ and $\tau{k+1}$, and equals zero everywhere outside $[\tau{k-1}, \tau{k+1}]$! For boundary nodes $\tau1$ and $\taum$, the outer wing stays flat ($\phi1(t) = 1$ for $t \le \tau1$; $\phim(t) = 1$ for $t \ge \taum$):
$$\phik(t) = \begin{cases} \dfrac{t - \tau{k-1}}{\tauk - \tau{k-1}}, & \tau{k-1} \le t \le \tauk \\[6pt] \dfrac{\tau{k+1} - t}{\tau{k+1} - \tauk}, & \tauk < t \le \tau{k+1} \\[6pt] 0, & \text{otherwise} \end{cases} \qquad \implies \sum{k=1}^{m} \phi_k(t) \equiv 1 \;\; \forall\, t > 0$$
Look at that Partition of Unity identity $\sum{k=1}^m \phik(t) \equiv 1$: summing all $m$ triangular tent shocks simultaneously reconstructs a flat $+1\text{ bp}$ parallel shift across the entire yield curve, proving mathematically that $\sum{k=1}^m KRDk = D_{eff}$ (up to second-order convexity negligible at $1\text{ bp}$)!
Worked 4-Node KRD Partial DV01 Decomposition of an Off-Pillar 7Y Note#
- Key-Rate Grid: tau = { 2Y, 5Y, 10Y, 30Y }; Flat Spot Curve z(t) = 4.40% semiannual (D_mod = 5.8942 years)
- Where Do the 7-Year Bond's Cashflows Land on the Tent Grid?
- Semiannual coupons t = 0.5, 1.0, 1.5, 2.0Y (PV = $8.24M) -> Split across <=2Y flat wing!
- Coupons t = 2.5Y .. 5.0Y (PV = $10.89M) -> Linearly split between 2Y and 5Y tents!
- Coupons t = 5.5Y, 6.0Y, 6.5Y (PV = $4.79M) -> Split between 5Y and 10Y tents!
- Final Principal + Coupon at t = 7.0Y (PV = $76.08M -> 76.1% of total PV!):
- 5Y Tent Weight at t = 7.0Y: phi_5(7.0) = (10 - 7) / (10 - 5) = 3 / 5 = 0.6000!
- 10Y Tent Weight at t = 7.0Y: phi_10(7.0)= (7 - 5) / (10 - 5) = 2 / 5 = 0.4000!
- Exact Partial Key-Rate Durations & Partial DV01s ($100M Position):
- KRD2Y = 0.0984 yrs => Partial DV012Y = $984 / bp ( 1.67% of risk)
- KRD5Y = 3.4926 yrs => Partial DV015Y = $34,926 / bp (59.25% of risk)
- KRD10Y = 2.3032 yrs => Partial DV0110Y = $23,032 / bp (39.08% of risk)
- KRD30Y = 0.0000 yrs => Partial DV0130Y = $0 / bp ( 0.00% — zero cashflows > 10Y!)
- Sum Check: 0.0984 + 3.4926 + 2.3032 + 0.0000 = 5.8942 years = Exact Fisher-Weil Modified Duration!
Notice how illuminating that 7-year bond KRD vector is: a trader without a 7Y future hedges $$100\text{M}$ of the 7Y cash bond by shorting $$34,926/\text{bp}$ of 5Y exposure and $$23,032/\text{bp}$ of 10Y exposure (plus a tiny $$984/\text{bp}$ 2Y coupon tail), immunizing both parallel level shifts AND 5s10s slope twists simultaneously!

Zero-Curve KRD vs Par-Curve KRD: Why Par-Yield KRDs Can Print Negative Numbers!#
Here is a famous quantitative interview & risk-desk puzzle under the KEY-RATE-DV01 2026 Benchmark Standard: Why does a 30-year coupon bond sometimes display slightly NEGATIVE 5Y and 10Y Key-Rate Durations on Bloomberg or swap-desk screens?
- On a Zero-Coupon Spot Curve KRD, every positive cashflow discounted by a higher zero rate falls in value, so $KRD_k^{zero} \ge 0$ always (for option-free bonds).
- On a Par-Yield / Par-Swap Curve KRD, bumping the 10-year par coupon yield upward by $+1\text{ bp}$ while holding the 30-year par coupon yield fixed forces the bootstrapped 30-year zero-coupon spot rate to drop slightly (because intermediate 10Y coupons inside the 30Y par bond now discount at a higher rate, requiring a lower 30Y zero rate to keep the 30Y par bond priced at $100.00$)! Thus a 30-year STRIP or low-coupon 30Y bond actually gains a few cents when 10Y par yields rise while 30Y par yields stay anchored—producing a small negative 10Y Par-KRD! See the full matrix algebra in par swap DV01 vs zero-rate PV01 Jacobian transformation!
Key-Rate Duration Fingerprints Across Bullets, Barbells, STRIPS & MBS#
| Portfolio / Instrument ($D_{eff} \approx 7.82\text{ yrs}$) | 2Y KRD | 5Y KRD | 10Y KRD | 30Y KRD | Sum $\sum KRD_k$ |
|---|---|---|---|---|---|
| 10-Year Par US Treasury Bullet | $0.08$ yrs | $0.31$ yrs | $7.43$ yrs | $0.00$ yrs | $7.82$ yrs |
| 2Y / 30Y Cash-Neutral Barbell | $1.15$ yrs | $0.00$ yrs | $0.24$ yrs | $6.43$ yrs | $7.82$ yrs |
| Ladder Portfolio (Equal 2Y..20Y) | $0.72$ yrs | $1.85$ yrs | $3.15$ yrs | $2.10$ yrs | $7.82$ yrs |
| 9-Year Zero-Coupon STRIP ($D=8.8y$) | $0.00$ yrs | $1.76$ yrs | $7.04$ yrs | $0.00$ yrs | $8.80$ yrs |
| Current-Coupon 30Y Agency MBS ($D=4.39y$) | $0.22$ yrs | $1.68$ yrs | $2.64$ yrs | $-0.15$ yrs | $4.39$ yrs |
Regulatory Governance: Basel IRRBB (19 Buckets) & ISDA SIMM (12 Vertices)#
Regulatory capital frameworks ban scalar duration completely: ISDA SIMM v2.6 requires OTC swap counterparties to report partial PV01 across 12 tenor vertices (2w to 30y) per currency with an empirical $12 \times 12$ correlation matrix, while Basel BCBS 368 IRRBB slots banking-book cashflows into 19 time buckets under six prescribed scenarios (Parallel Up/Down, Steepener, Flattener, Short-Rate Up/Down). Combine KRD bucketing with DV01-neutral barbell vs bullet strategies and PCA level, slope, and curvature hedging, and explore the Modified Duration & Key-Rate Hedging Topic Hub.
Frequently asked questions
Why must Key-Rate Duration shocks use triangular tents instead of rectangular step blocks?
Rectangular step shocks introduce infinite yield-slope discontinuities at bucket boundaries, causing tiny 1-day roll-downs across a bucket edge (such as 5.01Y rolling to 4.99Y) to trigger violent artificial DV01 jumps. Triangular tents interpolate smoothly across maturities.
How can a 30-year Treasury or STRIP have a negative 10-year Par Key-Rate Duration?
When shocking the 10-year PAR coupon yield +1 bp while forcing the 30-year PAR coupon yield to stay unchanged, intermediate 10Y coupons inside the 30Y par bond discount lower, forcing the bootstrapped 30Y zero-coupon rate slightly DOWN—slightly lifting a 30Y STRIP’s price!
Why does a 30-year agency MBS show most of its Key-Rate Duration at 5Y and 10Y instead of 30Y?
Scheduled principal amortization, turnover (~6% CPR), and borrower refinancing waves driven by 10-year mortgage rates return the vast majority of MBS cashflows within 5 to 10 years, leaving minimal cashflow or refinancing sensitivity at the 30Y point.
How many Key-Rate buckets are optimal for hedging a standard institutional bond portfolio?
While ISDA SIMM uses 12 vertices for OTC derivatives margin, cash fixed-income desks typically execute hedges across 4 to 6 liquid futures/benchmark pillars (2Y, 5Y, 10Y, 20Y, and 30Y) to avoid paying bid-ask spreads on illiquid off-the-run tenors.
Publication record
- Published
- 14 November 2026
- Updated
- 14 November 2026
- Author
- Elena Rostova, FRM, CQF
- Review
- Review not recorded
- Automated fact check
- Passed in the stored pipeline record
- Source URLs
- 3 recorded
AI assistance recorded: anthropic/claude-opus-4.6. This field does not establish human review or source verification.
Academic & Institutional Attribution
Cite This Research & Embed Live Data Card
Standard academic & institutional research paper citation format.
Elena Rostova, FRM, CQF. (2026, November 14). Key-Rate Duration (KRD) Tent Functions: Partial DV01 Curve Bucketing Math. QuantCalc Tools. https://quantcalctools.com/guides/key-rate-duration-krd-tent-function-partial-dv01-curve-bucketingRelated Bond Duration Convexity Math & Institutional Briefings
Explore Bond Duration Convexity Math Hub (20) →Bond Duration Convexity Math
Modified Duration, Convexity, DV01 & Key-Rate Hedging: 2026 Quantitative GuideBond Duration Convexity Math
50/50 vs Regression-Weighted 2s5s10s Butterfly Curve Trades: DV01 MathBond Duration Convexity Math
Cheapest-to-Deliver (CTD) Treasury Futures Conversion Factor & DV01 MathBond Duration Convexity Math
Leveraged Treasury Repo Carry, Curve Rolldown & Breakeven Yield Spike MathBond Duration Convexity Math
Redington Liability Immunization: Duration Matching & Convexity Dispersion MathBond Duration Convexity Math
Zero-Coupon STRIPS Convexity Scaling: Quadratic Maturity Leverage MathBond Duration Convexity Math
Par Swap DV01 vs Zero-Rate PV01: Jacobian Curve Transformation MathBond Duration Convexity Math
ACT/ACT ICMA vs 30/360 Accrued Interest & Odd-Stub Duration Bias MathCovered Interest Parity Forwards
SOFR, ESTR & SONIA OIS Compounded In-Arrears FX Forward Discounting MathCovered Interest Parity Forwards
FX Carry-to-Volatility Ratio, Forward Discount Puzzle & Breakeven Spot MathCovered Interest Parity Forwards
Non-Deliverable Forward (NDF) Cash Settlement & Implied Offshore Yield MathCovered Interest Parity Forwards
Historic-Rate vs Market-Rate FX Swaps: Uneven Notional & NPV Tail Math
QuantCalc Tools Data, Benchmarks & Contributor Records
CC BY 4.0 Open Data
Open Institutional Datasets (CSV / JSON) →
Download desk-compiled quantitative series & schemas.
2026 Reference Matrix
2026 Institutional Benchmarks & Thresholds →
Statutory capital, clearing, margin & rate conventions.
Editorial Records
Authors & Review Records →
View named contributors where those records are available.
Complete Index
Master Research & Dossier Archive →
Browse all published briefings by topic pillar & date.