
Probabilistic & Deflated Sharpe Ratio (DSR): Backtest Multiple-Testing Math
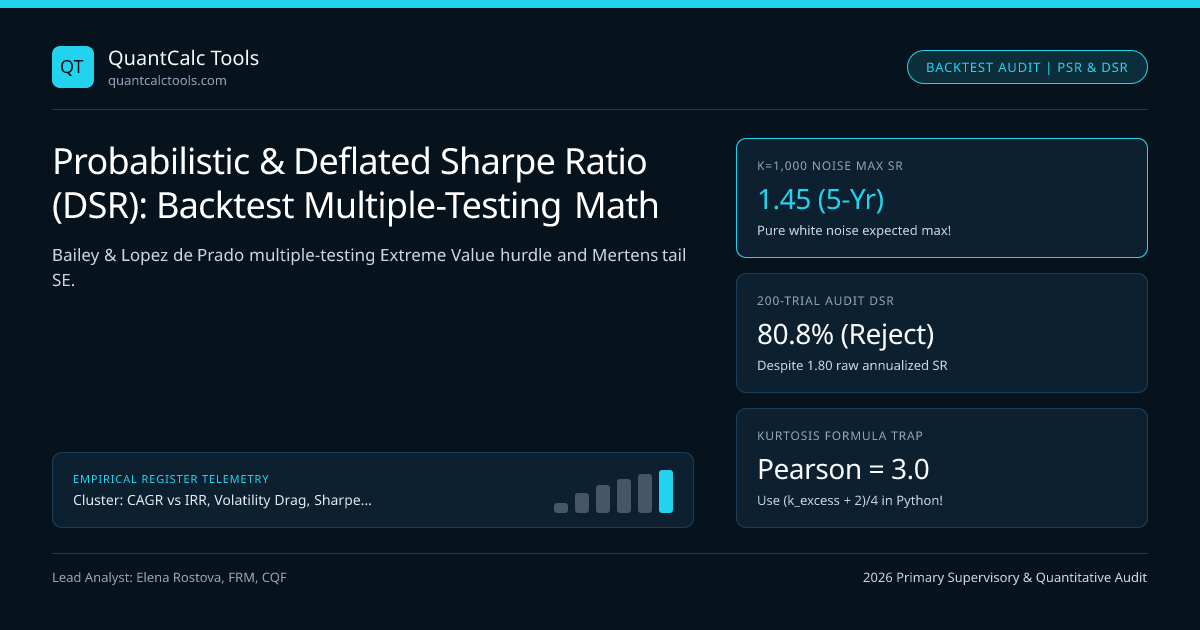
Testing 250 strategy variations on 5 years of random noise guarantees an expected maximum backtest Sharpe Ratio above 1.45 purely by luck; master exact PSR, DSR, and MinTRL equations.
Modern cloud clusters let a quantitative researcher sweep $K = 500$ moving-average windows, RSI thresholds, and ML hyperparameters before lunch, pick the single equity curve with a $2.10$ annualized Sharpe Ratio, and pitch it to an investment committee. Without adjusting for multiple-testing selection bias (data snooping) and non-normal higher moments, that $2.10$ backtest is statistically indistinguishable from pure white noise! David Bailey and Marcos Lopez de Prado (2012, 2014) solved this crisis in empirical finance by introducing the Probabilistic Sharpe Ratio (PSR), Minimum Track Record Length (MinTRL), and Deflated Sharpe Ratio (DSR). Benchmark raw ratios in our Sharpe & Sortino Ratio Calculator, review Lo (2002) Sharpe statistics, and anchor in our CAGR, IRR & Drawdown Hub.
Exact Equations: PSR, MinTRL, Expected Maximum Sharpe $\text{SR}_0$, and DSR#
Work strictly in non-annualized sample frequency ($N$ observations, non-annualized sample Sharpe $\widehat{\text{SR}}$, skewness $\hat{\gamma}3$, and **Pearson kurtosis $\hat{\gamma}4$ where Normal $= 3.0$—never confuse Pearson $\gamma4 = 3$ with excess kurtosis $0$, or the $((\gamma4 - 1)/4)\widehat{\text{SR}}^2$ term goes wrong!). First, PSR** computes the probability that true skill exceeds benchmark hurdle $\text{SR}^$ given non-normal skew/kurtosis. Second, DSR* sets that hurdle $\text{SR}_0$ equal to the Expected Maximum Sharpe Ratio across $K$ independent zero-skill trials via Extreme Value Theory (Euler-Mascheroni constant $\gamma \approx 0.57721566$):
- Non-Normal Variance Weight : Vmertens = 1 - gamma3 * SRhat + ((gamma4 - 1) / 4) * SRhat^2 [Pearson gamma4 = 3 for Normal!]
- 1. Probabilistic Sharpe : PSR(SR) = Phi( [ (SR_hat - SR) * sqrt(N - 1) ] / sqrt(V_mertens) )
- 2. Min Track Record Length : MinTRL(alpha) = 1 + Vmertens * [ z{1-alpha} / (SR_hat - SR*) ]^2 (in sample periods!)
- 3. Expected Max Sharpe across K Independent Zero-Skill Trials (Variance of Trial SRs = Var[{SR_k}]):
- SR0 = sqrt( Var[{SRk}] ) * [ (1 - gamma) * Phi^(-1)(1 - 1/K) + gamma * Phi^(-1)(1 - 1/(K * e)) ]
- where Euler-Mascheroni gamma = 0.57721566, e = 2.7182818, and under IID unit trials Var[{SR_k}] ~= 1/N (or q/N annualized)
- 4. Deflated Sharpe Ratio : DSR = PSR( SR* = SR_0 ) [Require DSR >= 0.95 to reject data-mining null!]
- Worked Backtest Overfitting Audit (5 Years Monthly N = 60, Reported Annualized SR = 1.80 -> Monthly SR_hat = 0.5196):
- Assume K = 200 parameter trials tested (Annualized std across trials = 0.45 -> Monthly std = 0.1299),
- Skew gamma3 = -1.20, Pearson Kurtosis gamma4 = 6.50:
- 1. Expected Max Lucky Monthly Hurdle SR_0:
- Phi^(-1)(1 - 1/200) = 2.5758; Phi^(-1)(1 - 1/543.66) = 2.9045
- Bracket = 0.42278(2.5758) + 0.57722(2.9045) = 2.7655
- Monthly Hurdle SR_0 = 0.1299 * 2.7655 = 0.3592 (Equivalent to 1.244 Annualized Sharpe purely from luck!)
- 2. Non-Normal Denominator V_mertens = 1 - (-1.20)(0.5196) + (5.50/4)(0.2700) = 1 + 0.6235 + 0.3713 = 1.9948
- 3. DSR = Phi( [ (0.5196 - 0.3592) * sqrt(59) ] / sqrt(1.9948) ) = Phi( 1.2320 / 1.4124 ) = Phi(0.872) = 80.8%!
- Verdict: FAILS 95% institutional gate (80.8% < 95.0%)! Overfitted across 200 trials with negative skew!
Look at how devastating that audit is: an annualized Sharpe of $1.80$ over 5 years has a naive Gaussian single-trial $z$-score of $1.80 \times \sqrt{5} = 4.02$ ($p = 0.00003$, 99.997% confidence!), yet once we account for sweeping $K = 200$ parameter combinations and negative skew $\gamma_3 = -1.20$, confidence plunges to 80.8% (p = 0.192)—failing institutional deployment gates!
Expected Maximum Sharpe Ratio of Pure Noise Across $K$ Trials ($T = 5$ Years IID)#
Under $T = 5$ years of zero-skill Gaussian white noise (annualized trial standard deviation $\sigma{\{\text{SR}\}} = 1/\sqrt{5} = 0.4472$), watch how rapidly the **Expected Maximum Backtest Sharpe Ratio $\mathbb{E}[\maxk \widehat{\text{SR}}_k]$** climbs purely by luck as a researcher tests more variations:
Extreme-Value Noise Floor: Expected Maximum Sharpe Across K Backtest Trials#
Quantify the exact annualized Sharpe Ratio generated purely by Gaussian luck across parameter grid sweeps:
| Independent Strategy Trials Tested ($K$) | Extreme-Value Multiplier ($Z_{\max}$) | Expected Max Noise Sharpe ($T = 5\text{y}$) | Expected Max Noise Sharpe ($T = 2\text{y}$) | Minimum 5y Backtest SR Needed for DSR = 95% (Normal) |
|---|---|---|---|---|
| $K = 1$ (True Pre-Registered Hypothesis) | $0.00\,\sigma$ | $0.00$ | $0.00$ | $0.74$ |
| $K = 10$ (Small Parameter Grid) | $1.54\,\sigma$ | $0.69$ | $1.09$ | $1.45$ |
| $K = 100$ (Feature Selection Sweep) | $2.51\,\sigma$ | $1.12$ | $1.77$ | $1.91$ |
| $K = 1{,}000$ (ML / AutoML Grid Search) | $3.24\,\sigma$ | $1.45$ | $2.29$ | $2.27$ |
| $K = 10{,}000$ (Genetic / Deep Alpha Mining) | $3.85\,\sigma$ | $1.72$ | $2.72$ | $2.58$ |
Estimating Effective Independent Trials ($K_{\text{eff}}$) When Sweep Grids Are Correlated#
What if those $200$ backtested variations were moving averages from MA(10) to MA(209) whose return streams are $92\%$ correlated with one another? Treating $K = 200$ as $200$ independent trials would over-penalize the strategy! Lopez de Prado & Lewis (2019) resolve correlated grids by clustering the $K \times K$ trial correlation matrix (or using average pairwise correlation $\bar{\rho}$ via $K{\text{eff}} \approx 1 + (K - 1)(1 - \bar{\rho})$): if $200$ sweeps have $\bar{\rho} = 0.85$, effective independent trials equal $K{\text{eff}} = 1 + 199(0.15) \approx 31$, giving an exact, fair selection-bias hurdle!
Combining DSR with Lo Autocorrelation and Out-of-Sample Paper Verification#
Before allocating live margin on FIX API or MT5 infrastructure, chain both Lo (2002) serial-correlation unsmoothing, Information Ratio breadth checks, AND Bailey-Lopez de Prado DSR, verify skewness/kurtosis tail exposure via Cornish-Fisher Modified VaR, and review our transparent testing protocols in methodology and verify.
Frequently asked questions
What is the #1 coding bug engineers make when implementing PSR and DSR in Python?
Passing pandas/scipy default Fisher EXCESS kurtosis (where Normal = 0) into ((gamma_4 - 1) / 4) * SR^2! Bailey & Lopez de Prado wrote (gamma_4 - 1)/4 using PEARSON non-excess kurtosis (where Normal = 3, so (3-1)/4 = 0.5). If using scipy excess kurtosis k_excess, you MUST write ((k_excess + 2) / 4) * SR^2!
Can I plug annualized Sharpe Ratios directly into the PSR and DSR formulas?
No! Mertens’ higher-moment variance formula V = 1 - gamma_3*SR + ((gamma_4 - 1)/4)*SR^2 is strictly scale-specific to the observation frequency at which N, skewness gamma_3, and kurtosis gamma_4 are measured. Convert annualized SR back to per-period SR_hat = SR_ann / sqrt(q) first!
How do I calculate Minimum Track Record Length (MinTRL) for a live emerging manager?
Given monthly SR_hat = 0.35 (annualized 1.21) against benchmark SR* = 0, skew = -0.8, and Pearson kurtosis = 5.0, V_mertens = 1 + 0.28 + 0.1225 = 1.4025. At 95% confidence (z = 1.6449), MinTRL = 1 + 1.4025 * (1.6449 / 0.35)^2 = 31.99 months (~2.67 years minimum track record).
Does Combinatorial Purged Cross-Validation (CPCV) replace the Deflated Sharpe Ratio?
They are complementary! DSR tests whether the best point-estimate Sharpe beats the multiple-testing noise floor analytically, whereas CPCV generates an empirical distribution of out-of-sample paths to measure the Probability of Backtest Overfitting (PBO) directly.
Publication record
- Published
- 13 November 2026
- Updated
- 14 November 2026
- Author
- Elena Rostova, FRM, CQF
- Review
- Review not recorded
- Automated fact check
- Passed in the stored pipeline record
- Source URLs
- 4 recorded
AI assistance recorded: anthropic/claude-opus-4.6. This field does not establish human review or source verification.
Academic & Institutional Attribution
Cite This Research & Embed Live Data Card
Standard academic & institutional research paper citation format.
Elena Rostova, FRM, CQF. (2026, November 14). Probabilistic & Deflated Sharpe Ratio (DSR): Backtest Multiple-Testing Math. QuantCalc Tools. https://quantcalctools.com/guides/probabilistic-deflated-sharpe-ratio-multiple-testing-backtest-biasRelated Cagr Irr Drawdown Compounding & Institutional Briefings
Explore Cagr Irr Drawdown Compounding Hub (20) →Cagr Irr Drawdown Compounding
CAGR vs IRR, Volatility Drag, Sharpe/Sortino & Drawdown Recovery: 2026 GuideCagr Irr Drawdown Compounding
Sequence-of-Returns Risk & Withdrawal Depletion: Breaking CAGR InvarianceCagr Irr Drawdown Compounding
Constant-Weight Rebalancing Bonus & Shannon Demon Dispersion MathCagr Irr Drawdown Compounding
Daily Leveraged ETF Beta Slippage & Volatility Decay Math (2x, 3x, -1x)Cagr Irr Drawdown Compounding
Information Ratio, Tracking Error & Grinold-Kahn Fundamental Law MathCagr Irr Drawdown Compounding
Expected Maximum Drawdown of Brownian Motion (Magdon-Ismail Drift Math)Cagr Irr Drawdown Compounding
Simple vs Modified Dietz Return Formula: Sub-Period Cashflow Weighting MathCagr Irr Drawdown Compounding
Hedge Fund 2-and-20 Fee Drag, High-Water Mark & Hurdle Net CAGR MathKelly Margin Leverage Sizing
Reg T 50% Equity Margin vs FINRA Rule 4210 Portfolio Margin & House CallsKelly Margin Leverage Sizing
Risk of Ruin Math: Fixed-Dollar Markov Absorption vs Fixed-Fractional SizingKelly Margin Leverage Sizing
Inverse Coin-Margined vs Linear Dollar Perpetual Liquidation & Convexity MathKelly Margin Leverage Sizing
Volatility-Target, Wilder ATR Stop-Loss & Equal Risk Contribution Sizing
QuantCalc Tools Data, Benchmarks & Contributor Records
CC BY 4.0 Open Data
Open Institutional Datasets (CSV / JSON) →
Download desk-compiled quantitative series & schemas.
2026 Reference Matrix
2026 Institutional Benchmarks & Thresholds →
Statutory capital, clearing, margin & rate conventions.
Editorial Records
Authors & Review Records →
View named contributors where those records are available.
Complete Index
Master Research & Dossier Archive →
Browse all published briefings by topic pillar & date.