
Leveraged Treasury Repo Carry, Curve Rolldown & Breakeven Yield Spike Math
Forward fixed-income total return equals net repo carry plus yield-curve rolldown; dividing their sum by forward DV01 defines the exact basis-point yield spike a leveraged position survives.
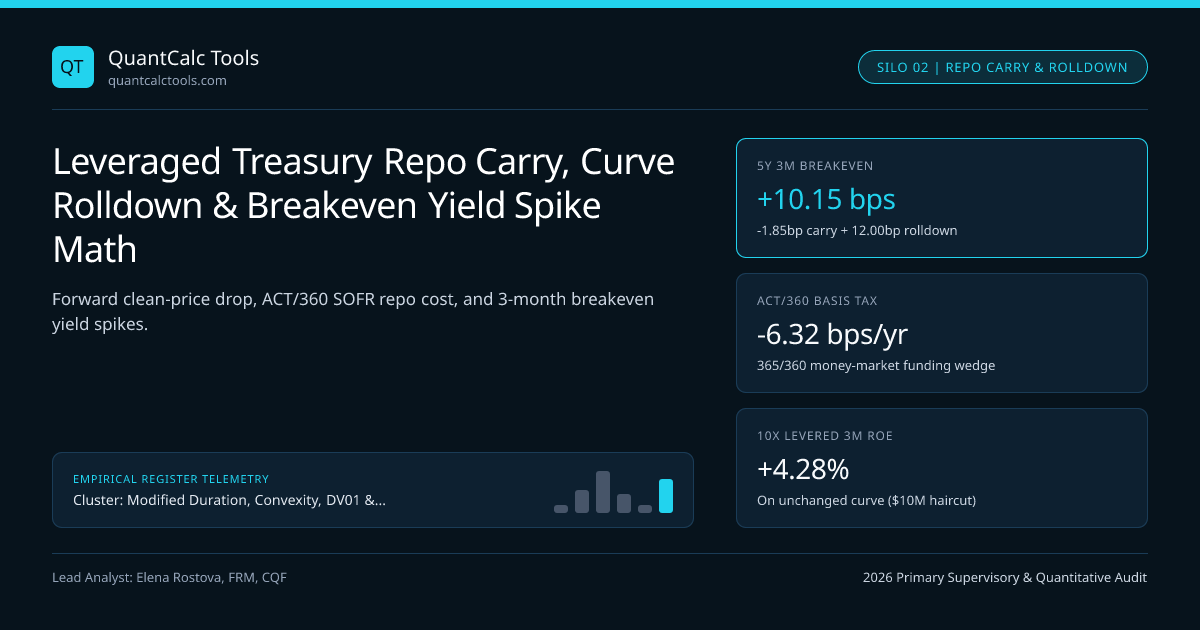
When overnight repo rates sit above coupon yields on an inverted yield curve, buying a Treasury bond financed at NY Fed SOFR Index ACT/360 suffers negative running Carry—yet can still generate positive expected return if Curve Rolldown down a steepening forward segment exceeds funding drag! Standardized on institutional sovereign desks via Leveraged Treasury Repo Carry & Breakeven Rolldown and interactive in our SOFR overnight compounding & carry calculator, Carry + Rolldown divided by Horizon DV01 quantifies the exact basis-point selloff cushion protecting a leveraged trade. Review foundational duration definitions in our Modified Duration, Convexity & DV01 master guide.
Exact Decomposition of Forward Drop, Net Repo Carry, and Curve Rolldown#
Consider buying a bond at dirty price $P{0}^{\text{dirty}} = P0 + AI0$ (yield $y0$, maturity $M$) and financing $100\%$ of the purchase price in term repo at ACT/360 rate $r{\text{repo}}$ over horizon $d$ days ($T = d/365$), collecting any interim coupon $C{\text{int}}$:
- Forward Breakeven Clean Price ($P_{\text{fwd}}$): Zero profit at horizon $T$ requires dirty proceeds to equal repo repayment:
$$P{\text{fwd}} + AIT + C{\text{int}} = (P0 + AI0)\left(1 + r{\text{repo}}\frac{d}{360}\right)$$
- Dollar & Basis-Point Carry: Holding the bond's yield constant at $y_0$ as maturity shortens to $M - T$ produces clean price $P(M-T, y0)$. Then Dollar Carry $= P(M-T, y0) - P{\text{fwd}}$ (which embeds coupon accrual, pull-to-par, minus ACT/360 repo interest!). Dividing by Horizon DV01 ($DV01{M-T}$) converts dollar carry into Basis-Point Carry: $\text{Carry}{\text{bps}} = \text{Dollar Carry} / DV01{M-T} \approx (y0 - r{\text{repo}}) \cdot \frac{T}{D_{\text{mod}, M-T}}$.
- Curve Rolldown & Total Breakeven Cushion: If the spot yield curve stays unchanged, a bond aging from $M$ to $M-T$ rolls to the prevailing yield $y(M-T)$ rather than staying at $y_0$! Thus:
$$\text{Rolldown}{\text{bps}} = y0(M) - y0(M - T), \qquad \Delta y{\text{Breakeven}} = \text{Carry}{\text{bps}} + \text{Rolldown}{\text{bps}}$$
Worked 3-Month Carry + Rolldown Audit on a 10x Leveraged 5-Year Note#
- Spot Curve Inputs:
- 5.00-Year Par Treasury: Coupon c = 4.30% semiannual, Clean = 100.000, AI0 = 0.000, YTM y5.00 = 4.300%
- 4.75-Year Aged Curve Point (Static Curve): YTM y_4.75 = 4.180% (-12.0 bps steeper 4.75s5.00s slope!)
- 91-Day Term GC Repo Rate (ACT/360): r_repo = 4.550% (Inverted vs 5Y YTM by -25 bps!)
- Horizon (4.75Y) Modified Duration: Dmodfwd = 4.2150 yrs => Horizon DV01 = $42,150 / bp on $100M
- 1) Exact 91-Day Dollar & Basis-Point Carry (Holding YTM = 4.300%):
- Repo Financing Cost (ACT/360) = $100,000,000 * 0.04550 * (91 / 360) = $1,150,139
- Accrued Coupon Earned (ACT/ACT, 91/182.5 of 2.15% semi) = $1,072,055
- Constant-Yield Clean Price P(4.75Y, 4.30%) = 100.0000 ($100,000,000)
- Net Dollar Carry = $1,072,055 - $1,150,139 = -$78,084 (-7.81 cents per $100 par)
- Carry in Basis Points = -$78,084 / $42,150 = -1.85 bps (Negative carry over 3 months!)
- 2) 91-Day Static-Curve Rolldown Gain (Rolling 5.00Y -> 4.75Y from 4.300% down to 4.180%):
- Rolldown Yield Drop = 4.300% - 4.180% = +12.00 bps!
- Dollar Rolldown Gain = +12.00 bps * $42,150/bp = +$505,800 (+50.58 cents per $100 par!)
- 3) Total 3-Month Breakeven Cushion & 10x Leveraged Equity Return ($10M Cash Haircut Equity):
- Total Breakeven Cushion = -1.85 bps (Carry) + 12.00 bps (Rolldown) = +10.15 bps (+$427,716 net profit!)
- Unchanged-Curve 3M Return on $10M Equity (10% Haircut): +$427,716 / $10,000,000 = +4.28% (+18.2% annualized!)
- Notice: Leverage k = 10x amplifies ROE 10x, yet BREAKEVEN YIELD SPIKE stays invariant at +10.15 bps!
Read that final line twice: leverage scales dollar return on equity linearly, but leaves your basis-point breakeven yield cushion ($+10.15\text{ bps}$) completely unchanged (assuming haircut equity earns repo interest)! Even though overnight repo ($4.55\%$) exceeds the 5Y yield ($4.30\%$)—producing $-1.85\text{ bps}$ of negative 3-month carry—the $+12.00\text{ bps}$ curve rolldown turns the trade strongly positive unless 4.75-year yields sell off by more than $+10.15\text{ bps}$!
The Hidden ACT/360 vs ACT/ACT Day-Count Tax in Repo Financing#
Why did $4.30\%$ YTM minus $4.55\%$ repo ($-25\text{ bps}$ nominal spread) cost $-\$78,084$ over 91 days instead of $-\$62,329$? Because US repo quotes on ACT/360 while US Treasury coupons accrue on ACT/ACT (ICMA)! Over a full 365-day year, a $4.55\%$ ACT/360 repo rate actually charges $4.55\% \times (365/360) = \mathbf{4.6132\%}$ ACT/365 simple equivalent—adding a silent $-6.32\text{ bps}$ annual funding drag that amateur spreadsheets miss completely! See full day-count mechanics in ACT/ACT ICMA vs 30/360 accrued interest math.
Horizon Carry + Rolldown Across the Sovereign Yield Curve (3-Month Horizon)#
| Curve Tenor ($100M Par,GC Repo = 4.55% ACT/360) | Spot YTM | 3M Carry (bps) | 3M Rolldown (bps) | Total Breakeven $\Delta y_{BE}$ | Carry-to-Vol Ratio (Annualized) |
|---|---|---|---|---|---|
| 2-Year Treasury ($D_{fwd} = 1.65\text{y}$) | $4.10\%$ | $-7.8\text{ bps}$ | $+4.0\text{ bps}$ | $-3.8\text{ bps}$ | $-0.14$ (Negative cushion) |
| 3-Year Treasury ($D_{fwd} = 2.58\text{y}$) | $4.18\%$ | $-4.4\text{ bps}$ | $+9.5\text{ bps}$ | $+5.1\text{ bps}$ | $+0.19$ (Moderate belly entry) |
| 5-Year Belly Sweet Spot ($D_{fwd} = 4.22\text{y}$) | $4.30\%$ | $-1.9\text{ bps}$ | $+12.0\text{ bps}$ | $+10.2\text{ bps}$ | $+0.41$ (Peak Risk-Adjusted!) |
| 10-Year Benchmark ($D_{fwd} = 7.62\text{y}$) | $4.45\%$ | $-0.5\text{ bps}$ | $+4.5\text{ bps}$ | $+4.0\text{ bps}$ | $+0.18$ (High DV01 dilutes bps) |
| 30-Year Long Bond ($D_{fwd} = 16.80\text{y}$) | $4.68\%$ | $+0.1\text{ bps}$ | $+0.8\text{ bps}$ | $+0.9\text{ bps}$ | $+0.04$ (Tiny bps cushion!) |

Variation Margin Survival & Cash-Futures Basis Arbitrage#
Notice why 30-year bonds make terrible static carry vehicles despite paying the highest nominal YTM ($4.68\%$): dividing modest dollar carry by a giant $$168,000/\text{bp}$ DV01 leaves less than 1 basis point of 3-month selloff protection! Pair leveraged cash repo analysis with CTD Treasury futures conversion-factor DV01 to monitor cash-futures basis trades, test compounded wealth drag in our CAGR calculator, and explore all fixed-income models on the Modified Duration & Key-Rate Hedging Topic Hub.
Frequently asked questions
Can a bond with negative repo carry still have a positive breakeven yield spike?
Yes! Whenever positive yield-curve rolldown down a steeper shorter-maturity segment exceeds negative repo carry (for example, -1.85 bps carry + 12.00 bps rolldown = +10.15 bps net), the position profits even if yields rise up to +10.15 bps!
Why do basis-point carry formulas divide by HORIZON forward DV01 instead of spot DV01?
Because the yield shock occurs at the end of the holding horizon T when the bond’s remaining maturity has shortened to M - T. Dividing horizon dollar carry by spot DV01 understates the true basis-point cushion on short-dated 2Y notes by up to 13%.
Why does the 30-year Treasury offer less than +1 bp of 3-month breakeven cushion despite paying the highest yield?
First, the yield curve between 29.75 years and 30.00 years is nearly flat, producing almost zero rolldown. Second, dividing a small positive coupon-minus-repo spread by a massive 16.8-year Modified Duration shrinks the basis-point cushion to under 1 bp.
How does repoleverage affect the basis-point breakeven yield move?
If cash equity posted for the repo haircut earns near the repo rate, leverage k cancels out of both numerator (k * Dollar Cushion) and denominator (k * DV01), leaving the basis-point breakeven move invariant while scaling ROE volatility k-fold!
Publication record
- Published
- 14 November 2026
- Updated
- 14 November 2026
- Author
- Elena Rostova, FRM, CQF
- Review
- Review not recorded
- Automated fact check
- Passed in the stored pipeline record
- Source URLs
- 3 recorded
AI assistance recorded: anthropic/claude-opus-4.6. This field does not establish human review or source verification.
Academic & Institutional Attribution
Cite This Research & Embed Live Data Card
Standard academic & institutional research paper citation format.
Elena Rostova, FRM, CQF. (2026, November 14). Leveraged Treasury Repo Carry, Curve Rolldown & Breakeven Yield Spike Math. QuantCalc Tools. https://quantcalctools.com/guides/leveraged-treasury-repo-carry-rolldown-breakeven-yield-spikeRelated Bond Duration Convexity Math & Institutional Briefings
Explore Bond Duration Convexity Math Hub (20) →Bond Duration Convexity Math
Modified Duration, Convexity, DV01 & Key-Rate Hedging: 2026 Quantitative GuideBond Duration Convexity Math
Redington Liability Immunization: Duration Matching & Convexity Dispersion MathBond Duration Convexity Math
Zero-Coupon STRIPS Convexity Scaling: Quadratic Maturity Leverage MathBond Duration Convexity Math
Par Swap DV01 vs Zero-Rate PV01: Jacobian Curve Transformation MathBond Duration Convexity Math
ACT/ACT ICMA vs 30/360 Accrued Interest & Odd-Stub Duration Bias MathBond Duration Convexity Math
TIPS Real-Yield Duration vs Nominal Treasury Empirical Beta Hedging MathBond Duration Convexity Math
Spread Duration vs Duration-Times-Spread (DTS): Credit Hedging MathBond Duration Convexity Math
Floating-Rate Note (FRN) Interest-Rate Reset Duration vs Spread Duration MathCovered Interest Parity Forwards
Historic-Rate vs Market-Rate FX Swaps: Uneven Notional & NPV Tail MathCovered Interest Parity Forwards
Cross-Rate Triangular FX Forward Arbitrage & Bid-Ask Swap Bounds MathCovered Interest Parity Forwards
Continuous Garman-Kohlhagen vs Discrete Money-Market CIP FX Options MathCovered Interest Parity Forwards
Synthetic USD Commercial Paper Funding: FX Swap Implied SOFR Spread Math
QuantCalc Tools Data, Benchmarks & Contributor Records
CC BY 4.0 Open Data
Open Institutional Datasets (CSV / JSON) →
Download desk-compiled quantitative series & schemas.
2026 Reference Matrix
2026 Institutional Benchmarks & Thresholds →
Statutory capital, clearing, margin & rate conventions.
Editorial Records
Authors & Review Records →
View named contributors where those records are available.
Complete Index
Master Research & Dossier Archive →
Browse all published briefings by topic pillar & date.