
Sharpe Ratio IID Annualization Trap & Lo (2002) Autocorrelation Haircut
Multiplying a monthly Sharpe ratio by sqrt(12) assumes strictly IID returns; when stale pricing or illiquid credit marks induce +0.35 AR(1) autocorrelation, naive Sharpe ratios overstate skill by +44.8%!
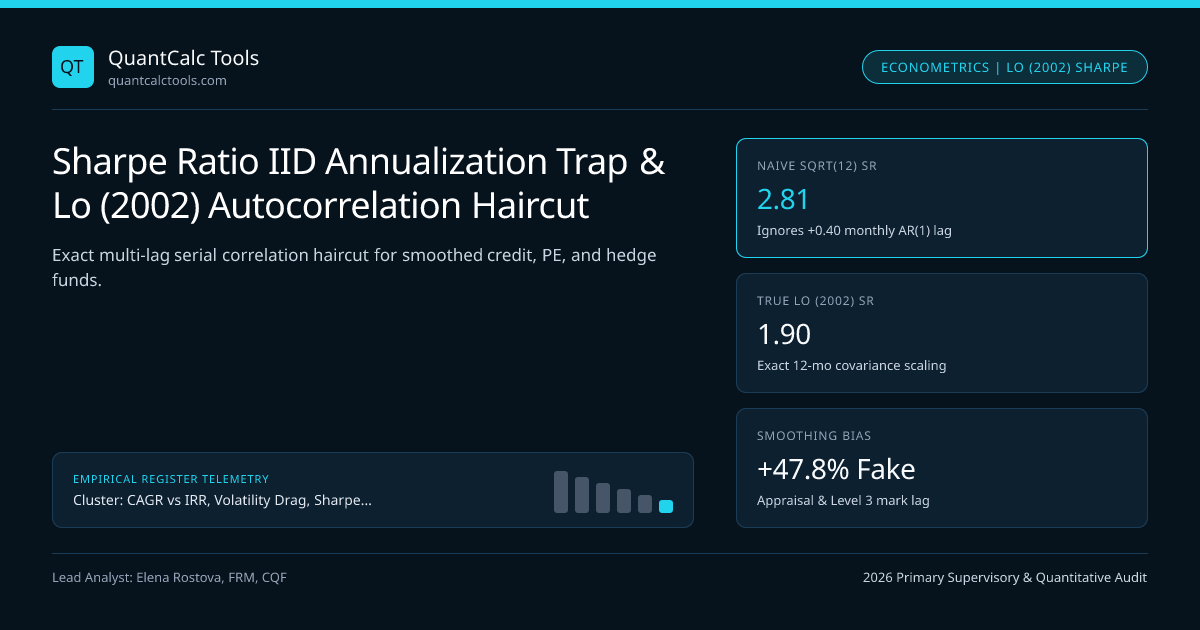
Every institutional allocator has seen private-credit, distressed-debt, or appraisal-valued real-estate pitchbooks boasting annualized Sharpe ratios of $2.80$ to $3.60$—triple the long-run S&P 500 Sharpe of $\sim 0.50$. Yet when stress hits, those "ultra-low-volatility" funds suffer the exact same $-25\%$ economic losses as public high-yield bonds! As MIT economist Andrew Lo proved in The Statistics of Sharpe Ratios (2002), multiplying a monthly Sharpe ratio $\widehat{\text{SR}}_1$ by $\sqrt{12} \approx 3.4641$ is mathematically valid if and only if period returns are Independently and Identically Distributed (IID). Test autocorrelation haircuts interactively in our Sharpe & Sortino Ratio Calculator, inspect the Lo (2002) Adjusted Sharpe Engine, and explore the CAGR, IRR & Drawdown Hub.
Exact Derivation of the Lo (2002) $q$-Period Variance Aggregation Multiplier#
Let $Rt$ be stationary monthly excess returns with expected value $\mu$, variance $\sigma^2$, and lag-$k$ serial autocorrelation $\rhok = \text{Cov}(Rt, R{t-k}) / \sigma^2$. Over $q = 12$ months, multi-period excess return sums linearly ($\mathbb{E}[R(q)] = q\mu$), but $q$-period variance includes all $q(q-1)$ cross-period covariance terms: $$\text{Var}\!\left(\sum{i=1}^q R{t-i+1}\right) = q\sigma^2 + 2\sigma^2 \sum{k=1}^{q-1}(q - k)\rhok$$ Dividing $q\mu$ by $\sqrt{\text{Var}(R(q))}$ yields the exact Lo (2002) Serial-Correlation Annualization Multiplier $\eta(q)$, alongside the asymptotic standard error $\text{SE}(\widehat{\text{SR}})$ for statistical significance testing:
- Naive IID Annualization : SRnaive(q) = sqrt(q) * (mu1 - rf1) / sigma1
- Exact Lo (2002) SR(q) : SRLo(q) = eta(q) * (mu1 - rf1) / sigma1
- Where Multiplier eta(q) = q / sqrt( q + 2 * Sum{k=1..q-1} [ (q - k) * rhok ] )
- Mertens (2002) / Lo Non-Normal Standard Error of Sample Sharpe Ratio (N observations):
- SE(SR1) = sqrt( [ 1 - S * SR1 + ((K - 1) / 4) * SR_1^2 ] / N )
- (Negative skew S < 0 and fat kurtosis K > 3 widen confidence intervals dramatically!)
- Worked Private-Credit / Distressed Hedge Fund Audit (Monthly Data, q = 12, N = 60 Months):
- Observed Monthly Excess Return = +0.65%/mo, Observed Monthly Vol = 0.80%/mo -> SR_1 = 0.8125
- 1. Naive IID Annualized Sharpe = sqrt(12) * 0.8125 = 3.4641 * 0.8125 = 2.81 (Looks legendary!)
- 2. Measured AR(1) Serial Autocorrelation rho1 = +0.40 (with geometric decay rhok = 0.40^k):
- Sum_{k=1..11} (12 - k) * 0.40^k = 11(0.40) + 10(0.16) + 9*(0.064) + ... = 7.1105
- Denominator = sqrt( 12 + 2 * 7.1105 ) = sqrt(26.221) = 5.1206
- Lo Multiplier eta(12) = 12 / 5.1206 = 2.3435 (vs 3.4641 naive!)
- 3. True Lo (2002) Annualized Sharpe = 2.3435 * 0.8125 = 1.90 (Naive sqrt(12) overstated Sharpe by +47.9%!)
Look at the economic intuition behind Getmansky-Lo-Makarov (2004) return smoothing: when a private credit or real-estate fund marks illiquid Level 3 assets by averaging dealer quotes or quarterly appraisals ($Rt^{\text{obs}} = \theta0 Rt^{\text{true}} + \theta1 R{t-1}^{\text{true}} + \theta2 R{t-2}^{\text{true}}$ with $\sum \thetai = 1$), observed monthly mean return is unchanged, while observed monthly variance shrinks to $(\theta0^2 + \theta1^2 + \theta2^2)\sigma{\text{true}}^2 < \sigma_{\text{true}}^2$! Naive $\sqrt{12}$ rewards stale marking as "risk-adjusted alpha," whereas Lo's covariance sum recovers the true 1-year economic volatility!
The Flip Side: Mean-Reverting Stat-Arb (rho_1 < 0) Is Understated by $\sqrt{252}$!#
Notice that Lo's adjustment cuts both ways! High-frequency market-making and short-horizon statistical arbitrage strategies frequently exhibit negative daily autocorrelation ($\rho1 = -0.18$) because bid-ask bounce and inventory mean reversion partially offset yesterday's mark-to-market noise. When $\rho1 < 0$, $\sum (q-k)\rhok < 0$, so true annual variance grows slower than $252\sigma{\text{daily}}^2$, meaning $\eta(252) > \sqrt{252}$—naive $\sqrt{252}$ actually penalizes genuine mean-reverting liquidity providers!
Lo (2002) Annualization Multipliers Across AR(1) Serial Correlation Regimes#
Contrast textbook $\sqrt{12}$ IID scaling against exact covariance-adjusted $\eta(12)$ multipliers from stat-arb to Level 3 real estate:
| AR(1) Monthly Correlation ($\rho1$, $\rhok = \rho_1^k$) | Typical Strategy Archetype | Naive $\sqrt{12}$ Factor | Exact Lo $\eta(12)$ Factor | Naive Sharpe Bias vs True Lo Sharpe |
|---|---|---|---|---|
| $-0.25$ (Mean-Reverting) | Short-horizon stat-arb / market-making | $3.4641$ | $4.3985$ | Naive understates by $-21.2\%$ |
| $0.00$ (Pure IID White Noise) | Liquid G10 FX / futures macro | $3.4641$ | $3.4641$ | $0.0\%$ (Exact match) |
| $+0.20$ (Mild Momentum / Lag) | High-yield bond / convertible arb | $3.4641$ | $2.8748$ | Naive overstates by $+20.5\%$ |
| $+0.40$ (Moderate Smoothing) | Private credit / distressed debt | $3.4641$ | $2.3435$ | Naive overstates by $+47.8\%$ |
| $+0.65$ (Heavy Appraisal Lag) | Direct real estate / Level 3 PE | $3.4641$ | $1.7208$ | Naive overstates by $+101.3\%$! |
Non-Normal Standard Errors: Why Short-Option Sharpe Confidence Intervals Explode#
Under Mertens' (2002) generalized standard-error formula $\text{SE}(\widehat{\text{SR}}1) = \sqrt{[1 - S\cdot\widehat{\text{SR}}1 + \frac{K-1}{4}\widehat{\text{SR}}1^2]/N}$, a short-put strategy with monthly $\widehat{\text{SR}}1 = 0.50$, negative skewness $S = -2.5$, and kurtosis $K = 13$ over $N = 36$ months has $\text{SE} = \sqrt{[1 + 1.25 + 3.0(0.25)]/36} = 0.289$—nearly double the Gaussian IID standard error $\sqrt{(1 + 0.50^2/2)/36} = 0.177$! Combine Mertens' non-normal SE with multiple-testing adjustments in Probabilistic & Deflated Sharpe Ratio (DSR), or switch to asymmetric risk denominators in Sortino downside semi-deviation math and Omega ratio threshold ranking.
Institutional Due-Diligence Protocol for Smoothed Track Records#
- Run Ljung-Box $Q(6)$ and Unsmoothing Regressions: Before ranking funds in our benchmarks directory, test monthly returns for $p < 0.05$ autocorrelation up to lag 6 and unsmooth via Getmansky-Lo-Makarov MA(2) MLE.
- Verify Excess-Return Numerator: Ensure risk-free NY Fed SOFR matches the exact currency and period frequency of $R_t$, and cross-check regulatory marketing compliance on the UK FCA register.
Frequently asked questions
Why does appraisal or dealer-quote smoothing reduce monthly volatility without reducing mean return?
Because replacing true return R_t with a weighted average theta_0*R_t + theta_1*R_{t-1} (where theta_0 + theta_1 = 1) preserves expected value E[theta_0*R_t + theta_1*R_{t-1}] = mu, while shrinking variance to (theta_0^2 + theta_1^2)*sigma^2 < sigma^2 (for 50/50 weights, variance drops by 50% and monthly vol drops by 29.3%!).
How many autocorrelation lags should I include when computing Lo’s SR(12) on a 5-year monthly track record?
Plugging all 11 raw sample autocorrelations from just N = 60 months introduces estimation noise (and can rarely yield a negative variance sum). Institutional engines either fit a parsimonious AR(1)/MA(2) model or apply Newey-West Bartlett kernel weights up to bandwidth m = floor(4*(N/100)^(2/9)) ~= 3 to 4 lags.
Should Sharpe ratios be computed using simple excess returns or log excess returns?
Always compute Sharpe ratios on simple single-period excess returns (R_t - r_{f,t}), NOT log returns, because portfolio expected excess return across assets is linear in simple returns and borrowing/financing at r_f accrues linearly over the single period.
What happens to the Sharpe ratio denominator when annualized excess return is negative?
Standard Sharpe ratio breaks down ranking monotony when excess return (mu - r_f) < 0: adding MORE volatility paradoxically makes a negative Sharpe ratio LESS negative (closer to zero)! When excess returns are negative, rank via Israelsen’s Modified Sharpe (mu - r_f) * sigma^(sign(mu - r_f)) or pure drawdown metrics.
Publication record
- Published
- 13 November 2026
- Updated
- 14 November 2026
- Author
- Elena Rostova, FRM, CQF
- Review
- Review not recorded
- Automated fact check
- Passed in the stored pipeline record
- Source URLs
- 4 recorded
AI assistance recorded: anthropic/claude-opus-4.6. This field does not establish human review or source verification.
Academic & Institutional Attribution
Cite This Research & Embed Live Data Card
Standard academic & institutional research paper citation format.
Elena Rostova, FRM, CQF. (2026, November 14). Sharpe Ratio IID Annualization Trap & Lo (2002) Autocorrelation Haircut. QuantCalc Tools. https://quantcalctools.com/guides/sharpe-ratio-iid-annualization-lo-2002-autocorrelation-haircutRelated Cagr Irr Drawdown Compounding & Institutional Briefings
Explore Cagr Irr Drawdown Compounding Hub (20) →Cagr Irr Drawdown Compounding
CAGR vs IRR, Volatility Drag, Sharpe/Sortino & Drawdown Recovery: 2026 GuideCagr Irr Drawdown Compounding
Sortino Ratio & Target Downside Semi-Deviation (MAR): Exact LPM2 MathCagr Irr Drawdown Compounding
Calmar, Sterling & Ulcer Performance Index: Path-Dependent Drawdown MathCagr Irr Drawdown Compounding
Omega Ratio Threshold Partition (LPM1): Full-Distribution Skew & Kurtosis MathCagr Irr Drawdown Compounding
Probabilistic & Deflated Sharpe Ratio (DSR): Backtest Multiple-Testing MathCagr Irr Drawdown Compounding
Sequence-of-Returns Risk & Withdrawal Depletion: Breaking CAGR InvarianceCagr Irr Drawdown Compounding
Constant-Weight Rebalancing Bonus & Shannon Demon Dispersion MathCagr Irr Drawdown Compounding
Daily Leveraged ETF Beta Slippage & Volatility Decay Math (2x, 3x, -1x)Kelly Margin Leverage Sizing
Isolated Margin vs Cross-Margin Liquidation & Bankruptcy Price FormulasKelly Margin Leverage Sizing
CME SPAN 2 Historical VaR Margin & Futures Maintenance Top-Up MathKelly Margin Leverage Sizing
ISDA SIMM v2.6 Uncleared OTC Initial Margin: Delta, Vega & Curvature MathKelly Margin Leverage Sizing
FX Pip-Value & Lot Sizing Calculator Math: Cross-Currency Conversion
QuantCalc Tools Data, Benchmarks & Contributor Records
CC BY 4.0 Open Data
Open Institutional Datasets (CSV / JSON) →
Download desk-compiled quantitative series & schemas.
2026 Reference Matrix
2026 Institutional Benchmarks & Thresholds →
Statutory capital, clearing, margin & rate conventions.
Editorial Records
Authors & Review Records →
View named contributors where those records are available.
Complete Index
Master Research & Dossier Archive →
Browse all published briefings by topic pillar & date.