
Asymmetric Drawdown Recovery Hyperbola & Breakeven Compounding Time Math
Portfolio losses obey a punishing hyperbola: losing 50% requires +100% to break even, while losing 75% requires +300% and 18 years at 8% CAGR; master exact recovery time math.
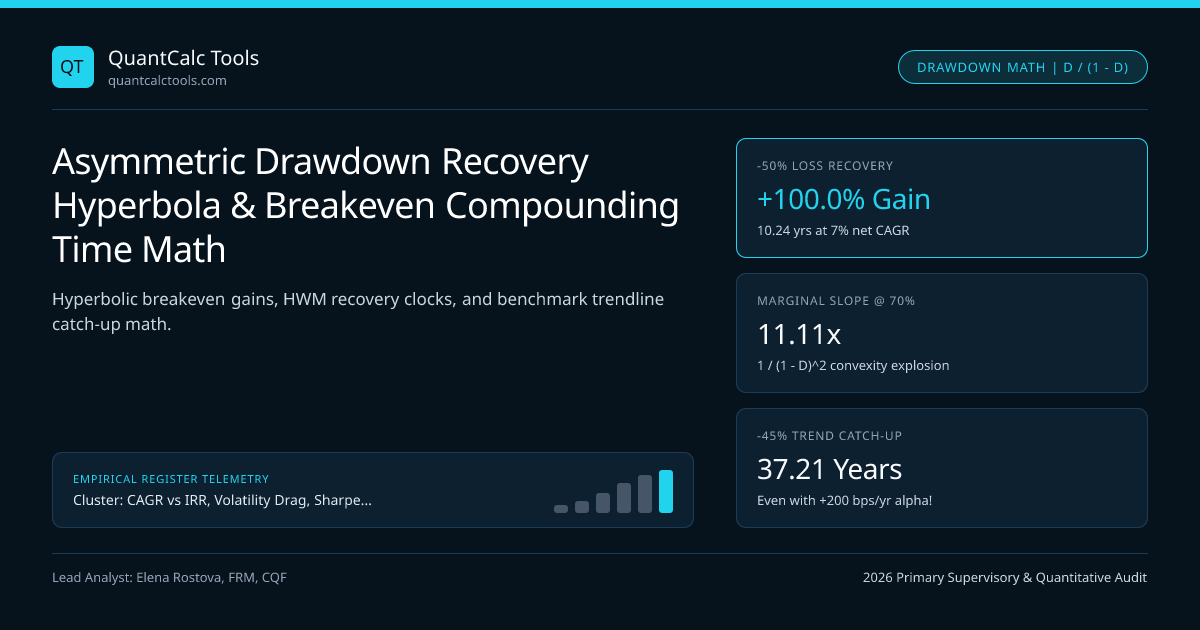
Nothing illustrates the asymmetry of multiplicative finance more starkly than drawdown math. Retail traders routinely treat a $-30\%$ loss and a $+30\%$ gain as symmetric offsets, yet $(1 - 0.30)(1 + 0.30) = 1 - 0.09 = 0.91$, leaving the account $-9.0\%$ underwater. Worse still, institutional High-Water Mark (HWM) accounting and endowment spending rules measure not just the percentage gain needed to climb back to $1.00$, but the opportunity cost against the compounding benchmark trajectory the capital missed while digging out of the hole! Model recovery trajectories in our CAGR Calculator, Kelly Criterion Calculator, and CAGR, IRR & Drawdown Hub.
Exact Equations for Breakeven Gain, HWM Recovery Time & Benchmark Catch-Up Time#
Let peak portfolio equity (High-Water Mark) be $W{\text{peak}}$ and trough equity after fractional drawdown $D \in (0, 1)$ be $W{\text{trough}} = W_{\text{peak}}(1 - D)$. We must distinguish two radically different recovery clocks:
- Nominal High-Water Mark Recovery ($T_{\text{HWM}}$): Years required at post-trough net CAGR $g > 0$ purely to restore $W_{\text{peak}}$ ($0\%$ net cumulative return across the crash + recovery cycle).
- Trendline Benchmark Catch-Up ($T_{\text{catch}}$): Years required at active outperformance CAGR $g > b$ to catch an un-crashed benchmark that kept compounding at $b$ throughout the drawdown!
- 1. Required Cumulative Gain to HWM : G_req = [ 1 / (1 - D) ] - 1 = D / (1 - D)
- 2. Years to Recover Nominal HWM : T_HWM = -ln(1 - D) / ln(1 + g)
- 3. Years to Catch Trendline (g > b) : (1 - D) * (1 + g)^Tcatch = (1 + b)^(Tdrop + T_catch)
- => Tcatch = [ Tdrop * ln(1 + b) - ln(1 - D) ] / ln( (1 + g) / (1 + b) )
- Worked Institutional Endowment Audit (-45.0% Drawdown over T_drop = 1.5 Years):
- 1. Required Breakeven Gain G_req = 0.45 / (1 - 0.45) = 0.45 / 0.55 = +81.82%!
- 2. Nominal HWM Recovery at g = +8.50% Net CAGR:
- T_HWM = -ln(0.55) / ln(1.085) = 0.59784 / 0.08158 = 7.33 Years strictly to return to $1.00!
- Total "Lost Decade" Cycle = 1.50y crash + 7.33y climb = 8.83 Years at 0.00% net return!
- 3. Trendline Catch-Up vs 6.50% Benchmark (Manager rebounds at g = +8.50%, +200 bps/yr alpha):
- T_catch = [ 1.5 * ln(1.065) - ln(0.55) ] / ln(1.085 / 1.065)
- = [ 0.09445 + 0.59784 ] / 0.018605 = 37.21 YEARS to overtake the un-crashed 6.5% benchmark!
Read Step 3 twice: even if a manager generates +$200\text{ bps}$ per year of genuine alpha (8.5% vs 6.5%) every single year after suffering a $-45\%$ drawdown, it takes $37.21$ years to overtake a boring benchmark strategy that avoided the $-45\%$ crater! That mathematical reality explains why institutional risk committees using our Omega & Calmar Drawdown Engine cap maximum portfolio drawdowns at $12\%\text{--}20\%$ via strict risk budgets.
Marginal Convexity of Losses: Why Every Extra $5\%$ Beyond $-40\%$ Is Lethal#
Take the first derivative of required recovery gain $G{\text{req}}(D) = D/(1-D)$ with respect to drawdown $D$: $$\frac{dG{\text{req}}}{dD} = \frac{1}{(1 - D)^2}$$ At a shallow $D = 10\%$ dip, $1/(0.90)^2 = 1.23\times$: losing $1\%$ more requires $+1.23\%$ more gain. At $D = 50\%$, $1/(0.50)^2 = 4.00\times$: losing $1\%$ more requires $+4.00\%$ more recovery gain. At $D = 80\%$, $1/(0.20)^2 = 25.0\times$: dropping from $-80\%$ to $-85\%$ ($5$ percentage points of peak equity) spikes required breakeven gain from $+400\%$ to $+566.7\%$ (+166.7 extra percentage points!).
Reference Schedule: Breakeven Gains, Marginal Slopes & HWM Recovery Years#
Benchmark exact hyperbolic recovery hurdles and compounding years across shallow pullbacks and catastrophic drawdowns:
| Peak-to-Trough Drawdown ($D$) | Trough Dollar Base | Breakeven Gain $D/(1-D)$ | Marginal Penalty $1/(1-D)^2$ | HWM Years at $7\%$ CAGR | HWM Years at $12\%$ CAGR |
|---|---|---|---|---|---|
| $-10.0\%$ | $\$0.90$ | $+11.11\%$ | $1.23\times$ | $1.56\text{ yrs}$ | $0.93\text{ yrs}$ |
| $-25.0\%$ | $\$0.75$ | $+33.33\%$ | $1.78\times$ | $4.25\text{ yrs}$ | $2.54\text{ yrs}$ |
| $-40.0\%$ | $\$0.60$ | $+66.67\%$ | $2.78\times$ | $7.55\text{ yrs}$ | $4.51\text{ yrs}$ |
| $-50.0\%$ | $\$0.50$ | $+100.00\%$ | $4.00\times$ | $10.24\text{ yrs}$ | $6.12\text{ yrs}$ |
| $-70.0\%$ | $\$0.30$ | $+233.33\%$ | $11.11\times$ | $17.79\text{ yrs}$ | $10.62\text{ yrs}$ |
| $-85.0\%$ | $\$0.15$ | $+566.67\%$ | $44.44\times$ | $28.03\text{ yrs}$ | $16.74\text{ yrs}$ |
Behavioral & Structural Amplification: Why Managers Rarely Achieve $g$ After Deep Losses#
Even the deterministic formula $T_{\text{HWM}} = -\ln(1-D)/\ln(1+g)$ is optimistic in live markets for three structural reasons:
- De-leveraging at the Bottom: Prime brokers hike haircuts or trigger VaR / margin close-out reductions at the trough, cutting post-drawdown position size so realized recovery growth $g{\text{post}} < g{\text{pre}}$.
- Hedge Fund Free-Option Walkaway: Below a $-35\%$ drawdown, earning $0\%$ performance fee for $5+$ years prompts talent flight or fund closure—analyzed in hedge-fund 2-and-20 High-Water Mark math.
- Spending / Redemption Bleed: Endowments withdrawing $5\%$ of initial corpus during a $-40\%$ slump accelerate ruin, quantified in sequence-of-returns withdrawal depletion math.
Embedding Drawdown Ceilings into Portfolio Construction#
Pair drawdown recovery diagnostics with Calmar, Sterling, and Ulcer Index ratios and Magdon-Ismail Brownian maximum drawdown bounds, size positions conservatively using Half-Kelly leverage, and inspect institutional client-protection rules on the UK FCA register and rankings directory.
Frequently asked questions
Why does a -50% loss followed by a +50% gain leave me down -25% instead of 0%?
Because percentage returns apply to sequential dollar bases: losing 50% on $100 drops equity to $50, and gaining +50% on that reduced $50 base adds only +$25, ending at $75 (-25% below $100). To add +$50 starting from a $50 base requires +$50 / $50 = +100.0%!
How do I calculate the annualized CAGR required to recover a drawdown D within exactly N years?
Invert the compounding equation (1 - D) * (1 + g)^N = 1 to solve directly for g = (1 / (1 - D))^(1 / N) - 1. For example, recovering a -35% drawdown (1 - D = 0.65) inside N = 3.0 years requires g = (1 / 0.65)^(1/3) - 1 = +15.44% net annualized CAGR.
Why do so many hedge funds shut down and return capital after a -30% to -35% drawdown?
Under a High-Water Mark (HWM) clause, the manager collects zero 20% incentive fees until recovering the +43% to +54% gain needed to reach prior peak NAV—a 4-to-6 year drought during which senior traders leave for rival desks where they can earn bonuses immediately from a fresh $1.00 par HWM.
Does dollar-cost averaging (DCA) shorten my personal breakeven clock during a market drawdown?
It lowers your average cost basis and lifts your Money-Weighted XIRR if new external savings buy shares near the trough, BUT it does not change the Time-Weighted CAGR recovery math of the pre-existing capital that suffered the drawdown.
Publication record
- Published
- 13 November 2026
- Updated
- 14 November 2026
- Author
- Elena Rostova, FRM, CQF
- Review
- Review not recorded
- Automated fact check
- Passed in the stored pipeline record
- Source URLs
- 4 recorded
AI assistance recorded: anthropic/claude-opus-4.6. This field does not establish human review or source verification.
Academic & Institutional Attribution
Cite This Research & Embed Live Data Card
Standard academic & institutional research paper citation format.
Elena Rostova, FRM, CQF. (2026, November 14). Asymmetric Drawdown Recovery Hyperbola & Breakeven Compounding Time Math. QuantCalc Tools. https://quantcalctools.com/guides/asymmetric-drawdown-recovery-hyperbola-breakeven-compounding-timeRelated Cagr Irr Drawdown Compounding & Institutional Briefings
Explore Cagr Irr Drawdown Compounding Hub (20) →Cagr Irr Drawdown Compounding
CAGR vs IRR, Volatility Drag, Sharpe/Sortino & Drawdown Recovery: 2026 GuideCagr Irr Drawdown Compounding
Sharpe Ratio IID Annualization Trap & Lo (2002) Autocorrelation HaircutCagr Irr Drawdown Compounding
Sortino Ratio & Target Downside Semi-Deviation (MAR): Exact LPM2 MathCagr Irr Drawdown Compounding
Calmar, Sterling & Ulcer Performance Index: Path-Dependent Drawdown MathCagr Irr Drawdown Compounding
Omega Ratio Threshold Partition (LPM1): Full-Distribution Skew & Kurtosis MathCagr Irr Drawdown Compounding
Probabilistic & Deflated Sharpe Ratio (DSR): Backtest Multiple-Testing MathCagr Irr Drawdown Compounding
Sequence-of-Returns Risk & Withdrawal Depletion: Breaking CAGR InvarianceCagr Irr Drawdown Compounding
Constant-Weight Rebalancing Bonus & Shannon Demon Dispersion MathKelly Margin Leverage Sizing
UK FCA COBS 22.5 & ESMA Retail Leverage Caps & 50% Margin Close-Out MathKelly Margin Leverage Sizing
Isolated Margin vs Cross-Margin Liquidation & Bankruptcy Price FormulasKelly Margin Leverage Sizing
CME SPAN 2 Historical VaR Margin & Futures Maintenance Top-Up MathKelly Margin Leverage Sizing
ISDA SIMM v2.6 Uncleared OTC Initial Margin: Delta, Vega & Curvature Math
QuantCalc Tools Data, Benchmarks & Contributor Records
CC BY 4.0 Open Data
Open Institutional Datasets (CSV / JSON) →
Download desk-compiled quantitative series & schemas.
2026 Reference Matrix
2026 Institutional Benchmarks & Thresholds →
Statutory capital, clearing, margin & rate conventions.
Editorial Records
Authors & Review Records →
View named contributors where those records are available.
Complete Index
Master Research & Dossier Archive →
Browse all published briefings by topic pillar & date.