
Parametric Var Expected Shortfall
Delta-Gamma Parametric VaR Formula: Quadratic Taylor Options Convexity Math
Linear Delta-Normal VaR treats short straddles as zero-risk portfolios; second-order Delta-Gamma Taylor expansions capture negative convexity mean shift, variance uplift, and left-tail skewness.
A delta-hedged short at-the-money straddle carries $\DeltaP = 0$, causing a naive linear Delta-Normal risk engine to report $$0.00$ Value-at-Risk right up until a 3-sigma underlying gap wipes out trading equity via negative gamma ($\GammaP < 0$) and short vega. Institutional derivatives risk systems link implied Greeks from a Black-Scholes-Merton Newton-Raphson Implied Volatility Solver into a quadratic Delta-Gamma Taylor series, propagating exact first, second, third, and fourth cumulants of portfolio PnL into Cornish-Fisher Modified Parametric VaR or Johnson/Britten-Jones chi-squared inversions. Compare baseline linear quantiles in our Value at Risk (VaR) calculator and review our Parametric VaR & Expected Shortfall calibration guide.
Exact Matrix Cumulants of Quadratic Delta-Gamma Portfolio Loss#
Let $\Delta S \sim \mathcal{N}(0, \Sigma)$ denote the $N \times 1$ vector of dollar underlying price changes over holding period $\Delta t$, $\delta$ the dollar delta vector, $\Gamma$ the $N \times N$ dollar gamma (Hessian) matrix, and $\Theta\Delta t$ deterministic theta carry. Second-order Taylor portfolio PnL is $\Delta P \approx \Theta\Delta t + \delta^\top \Delta S + \frac{1}{2}\Delta S^\top \Gamma \Delta S$. Using Gaussian quadratic-form trace identities for $Q = \frac{1}{2}\Gamma\Sigma$, the exact first four cumulants of $\Delta P$ are:
- Expected PnL Shift ($\kappa1 = \muP$): $\Theta\Delta t + \frac{1}{2}\text{tr}(\Gamma\Sigma)$ — Negative gamma shifts expected PnL downward even when $\mathbb{E}[\Delta S]=0$ (offsetting BSM theta carry under realized = implied vol)!
- Quadratic PnL Variance ($\kappa2 = \sigmaP^2$): $\delta^\top \Sigma \delta + \frac{1}{2}\text{tr}\big((\Gamma\Sigma)^2\big)$
- Third Central Moment ($\kappa_3$): $3\,\delta^\top \Sigma \Gamma \Sigma \delta + \text{tr}\big((\Gamma\Sigma)^3\big)$
- Fourth Cumulant ($\kappa_4$): $12\,\delta^\top \Sigma (\Gamma\Sigma)^2 \delta + 3\,\text{tr}\big((\Gamma\Sigma)^4\big)$
Worked Short-Straddle Delta-Gamma Cumulant & Cornish-Fisher VaR Audit#
- Position: Short 1,000 SPX Options Contracts ($100 multiplier) on Spot S = 5,800 (1d sigma = 1.20% -> sigma_S = $69.60)
- Greeks (Total Book): Net Delta (delta) = -200 shares-eq, Net Gamma (Gamma) = -180 shares/$ move, Theta_1d = +$185,000
- 1) Linear Delta-Normal VaR (Ignores -180 Gamma completely!):
- sigmalinear = |delta| * sigmaS = 200 * $69.60 = $13,920
- Delta-Normal 99% VaR = 2.32635 * $13,920 - $185,000 = $0 (Truncated at zero — COMPLETE BLINDNESS!)
- 2) Exact Quadratic Cumulants (sigmaS^2 = 4,844.16; Gamma * sigmaS^2 = -180 * 4,844.16 = -$871,949):
- Mean PnL (mu_P) = +$185,000 + 0.5 * (-$871,949) = -$250,974 (Realized vol exceeds theta cushion!)
- Variance (sigma_P^2)= (-200 * 69.60)^2 + 0.5 * (-$871,949)^2
- = 193,766,400 + 380,147,529,200 = 380,341,295,600 => sigma_P = $616,718!
- Third Moment (k_3) = 3 * (-13,920)^2 * (-871,949) + (-871,949)^3 = -5.068e14 - 6.629e17 = -6.634e17
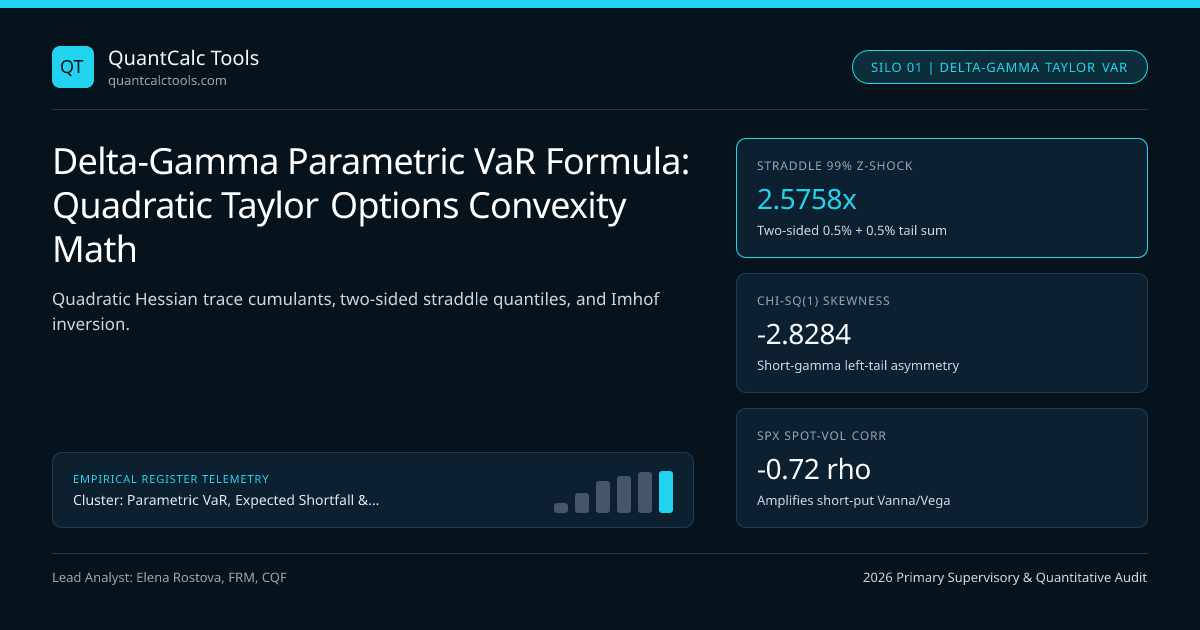
- Skewness (S) = k3 / sigmaP^3 = -6.634e17 / 2.3456e17 = -2.828 (Pure negative chi-squared skew!)
- Excess Kurtosis (Ke)= k4 / sigmaP^4 = 12.00 (1-df chi-squared kurtosis!)
- 3) Exact Non-Central Chi-Squared 99% Loss Quantile (z_0.995 = 2.57583 two-sided underlying tails!):
- Worst 1% Spot Shock (99.5% up or 0.5% down): Delta_S = +2.57583 * $69.60 = +$179.28 (since delta < 0!)
- Exact Taylor Loss at +$179.28 move:
- PnL = +$185,000 + (-200)(+179.28) + 0.5(-180)*(179.28)^2
- PnL = +$185,000 - $35,856 - $2,892,719 = -$2,743,575 -> Exact 99% Delta-Gamma VaR = $2,743,575!
Look at that stark contrast: Delta-Normal VaR prints $$0$, Cornish-Fisher hits its monotonicity ceiling because pure $\chi^2(1)$ has skewness $-2.83$ and excess kurtosis $+12.0$, and exact quadratic inversion reveals a $$2,743,575$ 1-day 99% VaR! Notice why the 99% loss on a short straddle uses the two-sided $99.5\%$ normal critical value ($z{0.995} = 2.5758$) rather than one-sided $z{0.99} = 2.3263$: both $+2.58\sigma$ rallies and $-2.58\sigma$ crashes breach the same negative-gamma loss threshold, summing $0.5\% + 0.5\% = 1.0\%$ total tail probability!
Spectral Diagonalization & Imhof Characteristic Function Inversion#
In a multi-asset options book (for example, dispersion desks trading SPX index options against top-50 constituent options alongside FX options), $\Sigma^{1/2}\Gamma\Sigma^{1/2} = U\Lambda U^\top$ diagonalizes the quadratic form into a sum of independent non-central chi-squared variables: $$\Delta P = \Theta\Delta t - \frac{1}{2}\sum{i=1}^N \frac{\tilde{\delta}i^2}{\lambdai} + \frac{1}{2}\sum{i=1}^N \lambdai \left(Zi + \frac{\tilde{\delta}i}{\lambdai}\right)^2, \qquad Z_i \stackrel{i.i.d.}{\sim} \mathcal{N}(0,1)$$ Rather than forcing extreme chi-squared moments through truncated Cornish-Fisher quantile expansions, production C++ and Rust engines evaluate Imhof's (1961) 1D numerical integral of the exact characteristic function $\psi(t) = \mathbb{E}[e^{it\Delta P}]$ or Lugannani-Rice saddlepoint approximations—delivering 6-decimal-place exactness in under $1.2\text{ ms}$.
Comparing Non-Linear Option Portfolio VaR Approximation Methods#
| Derivatives VaR Methodology | Captures Gamma? | Captures Vega & Vanna? | Barrier / Digital Pin Risk? | Relative Compute Cost | ||
|---|---|---|---|---|---|---|
| Linear Delta-Normal VaR | No ($0\%$) | Linear Vega only | Fails completely | $1\times$ ($0.02\text{ ms}$) | ||
| Delta-Gamma Cornish-Fisher | Moderate ($ | \Gamma | $ small) | Yes (Augmented $\Sigma$) | Fails (Polynomial folds) | $2\times$ ($0.05\text{ ms}$) |
| Delta-Gamma-Vega Imhof / Saddlepoint | Exact quadratic | Yes (Cross-Vanna Hessian) | Poor near barrier strike | $40\times$ ($1.10\text{ ms}$) | ||
| CME SPAN 2 Grid + Stress VaR | Yes (16-point scan + HVaR) | Yes (Up/Down IV shifts) | Captures discrete pin | Pre-computed clearing grid | ||
| Full-Revaluation BSM Monte Carlo | Exact all-order | Exact surface dynamics | Exact pathwise payoff | $4,500\times$ ($120\text{ ms}$) |
When Taylor Approximations Break: Barrier Options and Spot-Vol Vanna#
Even exact Imhof quadratic inversion fails in two specific derivatives regimes: (1) knock-out barrier options, binary digitals, and expiring ATM pin-risk options, where $\Gamma$ changes sign or approaches $\pm\infty$ across a 2-sigma spot move, and (2) omitting Spot-Vega correlation ($\rho_{S,\sigma} \approx -0.72$ in equity indices), where an equity crash simultaneously spikes implied volatility against short-put sellers! In those cases, switch to full-revaluation scenarios inside Cholesky covariance Monte Carlo VaR, validate BSM solver precision against the BSM-IMPLIED-VOL 2026 Standard, and explore the Parametric VaR & Expected Shortfall Topic Hub.
Frequently asked questions
Why does a delta-neutral short straddle require z = 2.5758 instead of z = 2.3263 for 99% 1-day VaR?
When Delta equals zero and Gamma is negative, losses depend on (Delta_S)^2 regardless of direction. A 1% total breach probability splits evenly into a 0.5% crash tail and a 0.5% rally tail, corresponding to the 99.5th normal percentile z = 2.57583.
Why does Cornish-Fisher often fail on pure delta-hedged option portfolios?
A pure quadratic normal form Z^2 follows a chi-squared(1) distribution with skewness sqrt(8) = 2.828 and excess kurtosis 12.0, lying outside the Maillard monotonicity envelope and requiring Imhof characteristic-function inversion or full revaluation.
How do you incorporate Vega and Vanna risk into a Delta-Gamma parametric VaR matrix?
Stack the N underlying spot shocks and M implied-volatility surface bucket shocks into an augmented (N + M) state vector, populate off-diagonal covariance blocks with negative spot-vol correlations, and insert Vanna (d^2V/dSd_sigma) and Volga (d^2V/d_sigma^2) into the Hessian.
When must derivatives desks abandon Delta-Gamma approximations for full revaluation?
Whenever second derivatives change sign inside the confidence interval—such as knock-out barriers, call spreads or butterflies spanning strikes, and 0DTE/1DTE options near expiration—local Taylor polynomials diverge wildly from bounded option payoffs.
Publication record
- Published
- 14 November 2026
- Updated
- 14 November 2026
- Author
- Elena Rostova, FRM, CQF
- Review
- Review not recorded
- Automated fact check
- Passed in the stored pipeline record
- Source URLs
- 3 recorded
AI assistance recorded: anthropic/claude-opus-4.6. This field does not establish human review or source verification.
Academic & Institutional Attribution
Cite This Research & Embed Live Data Card
Standard academic & institutional research paper citation format.
Elena Rostova, FRM, CQF. (2026, November 14). Delta-Gamma Parametric VaR Formula: Quadratic Taylor Options Convexity Math. QuantCalc Tools. https://quantcalctools.com/guides/delta-gamma-var-quadratic-taylor-options-convexity-adjustmentRelated Parametric Var Expected Shortfall & Institutional Briefings
Explore Parametric Var Expected Shortfall Hub (20) →Parametric Var Expected Shortfall
Parametric VaR, Expected Shortfall & Fat-Tail Risk Calibration: 2026 Quantitative GuideParametric Var Expected Shortfall
Filtered Historical Simulation (FHS): GARCH Bootstrap VaR & ES Math GuideParametric Var Expected Shortfall
Extreme Value Theory (EVT) Peaks-Over-Threshold: GPD VaR & ES Formula GuideParametric Var Expected Shortfall
Cholesky Factorization in Monte Carlo VaR: Fixing Broken Correlation GridsParametric Var Expected Shortfall
FRTB Stressed Expected Shortfall: Reduced-Factor MAR33.5 Calibration MathParametric Var Expected Shortfall
Acerbi-Szekely Expected Shortfall Backtesting: Non-Elicitability & Z2 MathParametric Var Expected Shortfall
Ledoit-Wolf Covariance Shrinkage in Portfolio VaR: Eigenvalue ConditioningParametric Var Expected Shortfall
Correlation Breakdown in Multi-Asset VaR: Stressed-Beta Contagion MathBond Duration Convexity Math
Redington Liability Immunization: Duration Matching & Convexity Dispersion MathBond Duration Convexity Math
Zero-Coupon STRIPS Convexity Scaling: Quadratic Maturity Leverage MathBond Duration Convexity Math
Par Swap DV01 vs Zero-Rate PV01: Jacobian Curve Transformation MathBond Duration Convexity Math
ACT/ACT ICMA vs 30/360 Accrued Interest & Odd-Stub Duration Bias Math
QuantCalc Tools Data, Benchmarks & Contributor Records
CC BY 4.0 Open Data
Open Institutional Datasets (CSV / JSON) →
Download desk-compiled quantitative series & schemas.
2026 Reference Matrix
2026 Institutional Benchmarks & Thresholds →
Statutory capital, clearing, margin & rate conventions.
Editorial Records
Authors & Review Records →
View named contributors where those records are available.
Complete Index
Master Research & Dossier Archive →
Browse all published briefings by topic pillar & date.