
Reg T 50% Equity Margin vs FINRA Rule 4210 Portfolio Margin & House Calls
Under static Reg T rules, a fully delta-hedged stock-plus-put collar still locks 50% initial margin, whereas FINRA Rule 4210 Portfolio Margin prices worst-case -15%/+15% TIMS stress.
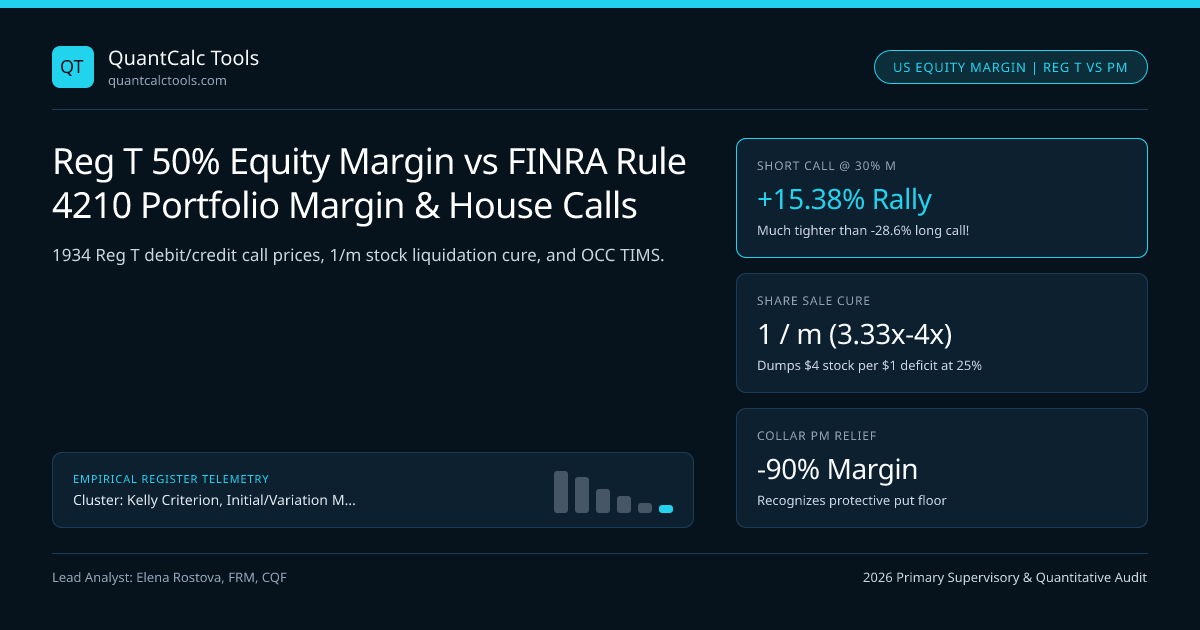
US equity and listed-option margin operates on a dual-track regulatory architecture: retail accounts below $100,000–$125,000 sit inside Federal Reserve Regulation T (Reg T, 12 CFR Part 220)—a strategy-blind rule from 1934 charging a flat 50% Initial Margin on long equities regardless of whether you hedged them with protective puts—paired with FINRA Rule 4210 25% (30% short) statutory maintenance floors plus broker "House Margin" overlays (30%–35%). Qualified institutional and sophisticated accounts migrate to FINRA Rule 4210(g) Portfolio Margin (PM), which runs OCC's Theoretical Intermarket Margining System (TIMS) across a 10-point Black-Scholes valuation grid (-15% to +15% for equities, -8%/+6% for broad-based indices), unlocking 6.7x hedged capital efficiency—and razor-sharp real-time liquidation risk if abused! Model option shocks with our BSM Implied Vol Solver, check sizing in the Kelly Criterion Calculator, and consult our Kelly, Margin & Liquidation Hub.
Exact Reg T Long & Short Maintenance Margin Call Price Derivations#
Let $P0$ be purchase (or short-sale) share price, $Q$ be shares, $D = Q P0 (1 - m{\text{init}})$ be fixed margin loan Debit Balance on a long position (50% Reg T `minit = 0.50), and $m$ be the broker's **House Maintenance Margin requirement** (25% FINRA minimum, typically 30% House on longs; 30% FINRA minimum, 35%` House on shorts). Notice why Short Maintenance Margin scales differently from Long Maintenance Margin: on a short sale, cash proceeds plus initial margin form a fixed Credit Balance $C = Q P0 (1 + m{\text{init}}) = 1.50 Q P_0$, while Liability $Q P$ grows as the stock rises!
- 1. Leveraged LONG Equity (Fixed Debit Loan D = Q * P0 * (1 - minit), House Maint = m):
- Equity(P) = QP - D >= m (QP) => Q P * (1 - m) >= D
- Exact Long Margin Call Price : Pcall,long = [ D / Q ] / (1 - m) = P0 * (1 - m_init) / (1 - m)
- At 50% Reg T + 25% FINRA Min : Pcall = P0 * 0.50 / 0.75 = 0.6667 * P_0 (-33.33% drop triggers call!)
- At 50% Reg T + 30% House Maint: Pcall = P0 * 0.50 / 0.70 = 0.7143 * P_0 (-28.57% drop triggers call!)
- 2. Leveraged SHORT Equity (Fixed Credit Balance C = Q * P0 * (1 + minit), House Short Maint = m_s):
- Equity(P) = C - QP >= m_s (QP) => Q P * (1 + m_s) <= C
- Exact Short Margin Call Price: Pcall,short = [ C / Q ] / (1 + ms) = P0 * (1 + minit) / (1 + m_s)
- At 50% Reg T + 30% FINRA Min : Pcall = P0 * 1.50 / 1.30 = 1.1538 * P_0 (ONLY +15.38% rally triggers call!)
- 3. Stock Liquidation Cure Multiplier vs Cash Wire Cure (House Maint Deficit = $Deficit):
- Cash Deposit Cure = 1.00 * $Deficit (Restores equity to exact m * Market_Value — unlike futures full-IM!)
- Share Sale Cure = (1 / m) * $Deficit (At m = 30%, broker MUST SELL 3.33x the dollar deficit in stock!)
Why Forced Share Liquidation Dumps 3.33x to 4.0x Your Dollar Margin Deficit#
Pause on *Equation 3 (`Share Sale Cure = (1 / m) Deficit)**: suppose your account sits at $3,000 House Maintenance Deficit at m = 25% (1 / 0.25 = 4.0x). Why doesn't selling $3,000 of stock cure a $3,000 margin call?! Because selling $3,000 of stock goes straight to paying down your Debit Loan (leaving **Equity $0 changed**!) while reducing required Maintenance Margin by only 0.25 * $3,000 = $750! Therefore, forced broker share liquidation must dump **4.0x ($12,000 of stock at 25% maint, or 3.33x at 30% maint)** for every $1` of margin deficit!
The Deadly SMA (Special Memorandum Account) Ratchet Trap in Reg T!#
Every US margin trader must understand Reg T SMA—the single most misunderstood account line item on Interactive Brokers, Schwab, and Fidelity! When your $100k stock rallies to $140k ($90k Equity on $50k Loan), Reg T credits +0.50 * $40k = +$20k into your SMA line. Crucial trap: if the stock subsequently drops back to $105k ($55k Equity), SMA DOES NOT DECREASE until used! A naive trader sees "Available SMA Buying Power: $40,000", buys $40,000 more stock ($95k Equity? No—$55k Equity against $145k Stock = 37.9% Margin, dangerously close to the 30% House Liquidation Cliff!), and gets liquidated on a routine -11% dip! Never size off SMA; size strictly off Excess Liquidity (Equity - House Maintenance)!
Capital Efficiency Comparison: Reg T vs FINRA 4210 Portfolio Margin ($500k Notional)#
Compare exact margin locked on four institutional equity/options structures:
Portfolio Position ($500,000 Underlying Notional) | Economic Max Loss | Static Reg T Margin | FINRA 4210 PM (TIMS) | Capital Efficiency Gain |
|---|---|---|---|---|
Unhedged Long SPY (S&P 500 Broad Index ETF) | -$500,000 | $250,000 (50.0%) | $40,000–$60,000 (8%–12%) | 4.2x – 6.2x (High crash risk if maxed!) |
Unhedged Long Single-Name Tech Stock (NVDA) | -$500,000 | $250,000 (50.0%) | $75,000–$125,000 (15%–25% House) | 2.0x – 3.3x |
Protective Collar (Long Stock + Long -5% Put / Short +5% Call) | -$25,000 Capped! | $250,000 (50% blind!) | ~$25,000 (Exact capped floor!) | 10.0x (True risk recognition!) |
| Delta-Neutral Iron Condor / Box / Dispersion Basket | Defined Wing Loss | Per-leg spread sum | Net TIMS 10-point max loss | 3.5x – 8.0x |
The Portfolio Margin Procyclicality Trap During Volatility Spikes (Archegos & Volmageddon)#
While Portfolio Margin is extraordinary for defined-risk hedged books (protective collars, long/short factor pairs, convertible arbitrage), using PM to lever unhedged short index puts at 6.5x is suicidal! During a crash (e.g., Feb 5, 2018 or March 2020), SPY drops -8% AND implied volatility surges from 14% to 65%, simultaneously slashing Net Liquidation Value while Broker House Risk Engines hike TIMS scan ranges from -8% to -24%—liquidating the entire account in milliseconds without waiting T+2! Pair PM options risk with short naked option gamma expansion math, CME SPAN 2 futures margin, and our Value-at-Risk Calculator.
Frequently asked questions
Why does a 2x leveraged SHORT stock hit a margin call after just a +15.38% rally while a 2x LONG stock survives a -28.57% drop?
Two compounding asymmetries: first, FINRA’s statutory minimum maintenance rate is higher on shorts (30%) than longs (25%); second, when a long stock drops, its Market Value shrinks (REDUCING required dollar maintenance 0.25*Q*P!), whereas when a short stock rallies, its Market Value GROWS (INCREASING required dollar maintenance 0.30*Q*P at the exact same time equity falls)!
Do US brokers give me 2 to 5 business days to answer a House Maintenance Margin call?
NO—never count on a grace period! Every US brokerage margin agreement explicitly states that "T+2/T+3 margin call notices are a courtesy only" and reserves the absolute contractual right to liquidate ANY shares in your account immediately in real time without prior warning whenever Excess Liquidity drops below $0.00!
How does FINRA’s $25,000 Pattern Day Trader (PDT) rule interact with overnight Reg T margin?
Accounts above $25,000 flagged as Pattern Day Traders receive 4:1 INTRADAY Day-Trading Buying Power (based on start-of-day Maintenance Excess), which MUST be reduced back down to 2:1 (50% Reg T) before the 4:00 PM EST market close—holding 4x intraday positions overnight triggers an immediate Reg T Regulation Call!
Can a prime broker override OCC TIMS 8%–15% scan ranges in a Portfolio Margin account?
Yes, instantly! FINRA Rule 4210 sets TIMS as a REGULATORY FLOOR, not a ceiling. Every prime broker and retail PM venue (IBKR, Schwab) overlays proprietary House Concentration, Liquidity, and Implied-Volatility multipliers that can jump from 15% to 50%–100% intraday on concentrated or earnings-event tickers.
Publication record
- Published
- 13 November 2026
- Updated
- 14 November 2026
- Author
- Elena Rostova, FRM, CQF
- Review
- Review not recorded
- Automated fact check
- Passed in the stored pipeline record
- Source URLs
- 4 recorded
AI assistance recorded: anthropic/claude-opus-4.6. This field does not establish human review or source verification.
Academic & Institutional Attribution
Cite This Research & Embed Live Data Card
Standard academic & institutional research paper citation format.
Elena Rostova, FRM, CQF. (2026, November 14). Reg T 50% Equity Margin vs FINRA Rule 4210 Portfolio Margin & House Calls. QuantCalc Tools. https://quantcalctools.com/guides/reg-t-50pct-equity-margin-vs-finra-4210-portfolio-margin-house-callRelated Kelly Margin Leverage Sizing & Institutional Briefings
Explore Kelly Margin Leverage Sizing Hub (20) →Kelly Margin Leverage Sizing
Kelly Criterion, Initial/Variation Margin & Liquidation Math: 2026 GuideKelly Margin Leverage Sizing
Risk of Ruin Math: Fixed-Dollar Markov Absorption vs Fixed-Fractional SizingKelly Margin Leverage Sizing
Inverse Coin-Margined vs Linear Dollar Perpetual Liquidation & Convexity MathKelly Margin Leverage Sizing
Volatility-Target, Wilder ATR Stop-Loss & Equal Risk Contribution SizingKelly Margin Leverage Sizing
Central Clearing Variation Margin Liquidity Spirals & Cash Buffer MathKelly Margin Leverage Sizing
Ralph Vince Optimal f & Terminal Wealth Relative (TWR): Empirical Sizing MathKelly Margin Leverage Sizing
Short Naked Option Margin Math: Reg T 20%/10% Rule & Gamma Crash ExpansionKelly Margin Leverage Sizing
Repo Haircut, Rehypothecation Multiplier & Leveraged Bond Carry MathIPO and Funding
Anthropic targets valuation of up to $1.4tn in stock market flotationMarket Insights
Why stocks are falling and 10-year yields are climbing back near 5% after Tuesday’s inflation reportIPO and Stock Market
Anthropic heads for lower than expected $1.3 trillion valuation in stock market debutMarket Insights
Stifel cuts Everus stock price target on valuation reset
QuantCalc Tools Data, Benchmarks & Contributor Records
CC BY 4.0 Open Data
Open Institutional Datasets (CSV / JSON) →
Download desk-compiled quantitative series & schemas.
2026 Reference Matrix
2026 Institutional Benchmarks & Thresholds →
Statutory capital, clearing, margin & rate conventions.
Editorial Records
Authors & Review Records →
View named contributors where those records are available.
Complete Index
Master Research & Dossier Archive →
Browse all published briefings by topic pillar & date.