
Treynor Ratio, Jensen’s Alpha & Modigliani M-Squared (M2) Leverage Math
When adding a sleeve to a diversified multi-manager book, systematic beta matters more than standalone sigma; master exact Treynor, Jensen Alpha, and Modigliani M-Squared (M2) equations.
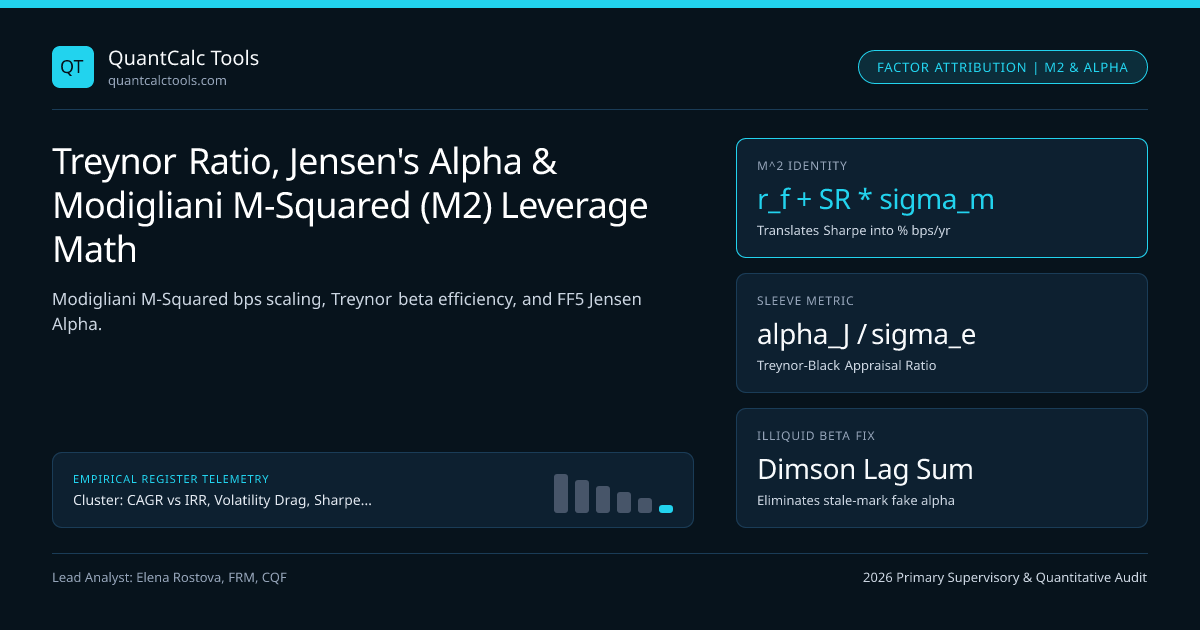
Investment committee debates routinely stall over which classical risk-adjusted metric actually applies to the decision on the table: if Fund A has a higher Sharpe Ratio (0.85 vs 0.72) while Fund B has a higher Treynor Ratio and higher Jensen's Alpha, which fund should the pension plan hire? And how do you explain a 0.85 vs 0.55 Sharpe difference in intuitive annualized percentage points to non-quant trustees? Answering both questions requires separating standalone total-portfolio choice (Sharpe & Franco/Leah Modigliani's M-Squared / M2) from marginal sub-portfolio sleeve allocation (Treynor & Treynor-Black Appraisal Ratio). Run side-by-side ratio checks in our Sharpe & Sortino Calculator and anchor in our CAGR, IRR & Drawdown Hub.
Unifying Sharpe, Modigliani $M^2$, Treynor, and Jensen's Alpha on One Balance Sheet#
Let $Rp$ be portfolio return, $Rm$ be market benchmark return (with volatility $\sigmam$), and $rf$ be the risk-free SOFR / T-bill rate. Decomposing total variance into systematic beta risk plus idiosyncratic residual variance $\sigmap^2 = \betap^2 \sigmam^2 + \sigma{\varepsilon}^2$ links all four classical performance metrics via exact algebraic identities:
- CAPM / Factor Decomposition: Rp - rf = alphaJ + betap * (Rm - rf) + epsilonp, sigmap^2 = betap^2*sigmam^2 + sigma_e^2
- 1. Modigliani M-Squared (M^2 — Volatility-Matched Return in % / bps!):
- Leverage/Cash Weight w* = sigmam / sigmap (De-lever if sigmap > sigmam; lever at rf if sigmap < sigma_m)
- M^2 = rf + (sigmam / sigmap) * (E[Rp] - rf) = rf + SRp * sigmam
- M^2 Alpha (in bps/yr) = M^2 - E[Rm] = (SRp - SRm) * sigmam
- 2. Treynor Ratio (Excess Return per Unit of Systematic Beta — Valid ONLY when beta_p > 0):
- Treynorp = (E[Rp] - rf) / betap = (E[Rm] - rf) + (alphaJ / betap)
- 3. Exact Link Between Sharpe & Treynor via Correlation rho_{p,m}:
- Since betap = rho{p,m} * (sigmap / sigmam) => SRp = (rho{p,m} / sigmam) * Treynorp
- Worked Pension Committee Paradox (rf = 4.50%, Market Benchmark E[Rm] = 10.50%, sigmam = 15.0% -> SRm = 0.40, Treynor_m = 6.00%):
- Fund A (Diversified Core, rho = 0.98): E[RA] = 11.70%, sigmaA = 12.0%, beta_A = 0.784
- > SRA = (11.70 - 4.50)/12.0 = 0.600 | M^2 = 4.50% + 0.60*(15%) = 13.50% (+300 bps M^2 Alpha!) | TreynorA = 7.20/0.784 = 9.18%
- Fund B (Concentrated Biotech Specialist, rho = 0.50): E[RB] = 14.50%, sigmaB = 20.0%, beta_B = 0.667
- > SR_B = (14.50 - 4.50)/20.0 = 0.500 (TRAILS Fund A on Sharpe & M^2 = 12.00%!)
- > Jensen AlphaB = 10.00% - 0.667*(6.00%) = +6.00%/yr! | TreynorB = 10.00 / 0.667 = 15.00% (CRUSHES Fund A!)
Look at why Fund A wins for a single-fund investor while Fund B wins as a $10\%$ satellite sleeve inside a multi-manager pension plan!
- If Fund B is your entire life savings, you bear all of its massive idiosyncratic biotech volatility ($\sigma_{\varepsilon} = 17.32\%$), so Sharpe (
0.60vs0.50) and Modigliani $M^2$ (13.50%vs12.00%) rightly crown Fund A. - Inside a 15-manager institutional portfolio, idiosyncratic variance $\sigma{\varepsilon}^2 / K$ diversifies away across uncorrelated managers! Only systematic $\betaB$ adds core market variance, and Fund B delivers
+600 bpsof Jensen's Alpha (Appraisal Ratio = 6.00% / 17.32% = 0.346), lifting the overall pension plan's Sharpe Ratio higher than Fund A can!
Realistic Institutional $M^2$ Adjustment When Margin Borrowing Exceeds $r_f$#
Textbook Modigliani $M^2$ assumes that if a low-volatility fund ($\sigmap = 8\%$) is scaled up by $w^* = 15\% / 8\% = 1.875\times$ to match equity index volatility ($\sigmam = 15\%$), the borrowed $0.875\times$ notional finances at the risk-free T-bill rate $rf$. In reality, institutional prime brokers or futures clearing members charge $rb = \text{SOFR} + s{\text{spread}}$ (+40 bps in futures, +125 bps on prime margin)! Exact Spread-Adjusted $M^2$ for $w^* = \sigmam / \sigmap > 1$ is: $$M^2{\text{real}} = w^* \mathbb{E}[Rp] - (w^* - 1)(rf + s{\text{spread}})$$ Subtracting $(w^* - 1) s{\text{spread}}$ prevents low-volatility bond arbitrage funds from claiming unattainable levered equity equivalence!
Governance Matrix: Modigliani M-Squared, Treynor, Jensen Alpha & Appraisal Ratio#
Align risk denominators and failure boundaries across standalone total-portfolio and multi-manager sleeve decisions:
| Classical Metric | Denominator / Risk Unit | Ranking Identical to Sharpe? | Multi-Factor Extension | Fails / Breaks Down When... |
|---|---|---|---|---|
| Modigliani $M^2$ | Scaled to $\sigma_m$ (% / bps) | 100% Identical! | Downside $M^2$ (Sortino-matched) | $w^* > 1$ ignores $r{\text{borrow}} > rf$ spread |
| Treynor Ratio | Systematic $\beta_p$ | No (ignores $\sigma_{\varepsilon}$) | Generalized Treynor (arbitrage pricing) | $\beta_p \le 0$ (market-neutral or short!) |
| Jensen's Alpha ($\alpha_J$) | None (raw % excess intercept) | No (scales with leverage!) | Carhart 4-Factor / FF5 Alpha | Levered $2\times$ fund doubles $\alpha_J$ artificially! |
| Appraisal Ratio | Idiosyncratic $\sigma_{\varepsilon}$ | Optimal weight $\propto \alphaJ / \sigma{\varepsilon}^2$ | Multi-factor residual IR | Stale marks hide true $\beta_p$ (Scholes-Williams) |
Multi-Factor Fama-French-Carhart Stripping of Apparent CAPM Alpha#
Single-factor CAPM regressions routinely mislabel cheap Size (SMB) and Value (HML) tilts as manager skill:
Two Critical Traps: Dimson Lagged Beta & Multi-Factor Alpha Stripping#
- Illiquid Assets Understate Contemporary $\beta_p$: Private credit, micro-cap stocks, and high-yield bonds react to S&P 500 moves with a $1\text{--}3$ month lag. Regressing $R{p,t}$ only on contemporaneous $R{m,t}$ artificially shrinks $\hat{\beta}p$ from $0.75$ down to $0.25$—fabricating $+300\text{ bps}$ of fake Jensen's Alpha! Always sum Dimson (1979) lagged betas $\beta{\text{Dimson}} = \beta0 + \beta1 + \beta_2$ alongside Lo (2002) autocorrelation adjustments.
- Upgrade Single-Index CAPM $\alpha_J$ to Fama-French 5-Factor + Momentum: Ensure managers are not charging active fees for cheap ETF factor betas; cross-reference Information Ratio and Tracking Error, Half-Kelly leverage sizing, and institutional broker margin schedules in broker lookup.
Frequently asked questions
Can two funds ever rank differently under Modigliani M-Squared (M2) versus the Sharpe Ratio?
No, provided excess returns are evaluated against the same risk-free rate r_f and single-borrowing-rate assumption! Because M^2 = r_f + SR_p * sigma_m where r_f and sigma_m (> 0) are identical positive constants for every fund being compared, M^2 is a strictly increasing linear transformation of SR_p.
Why shouldn’t I just pick the fund with the highest raw Jensen’s Alpha?
Because raw Jensen’s Alpha has no risk denominator! If Fund X has +1.5% alpha with 2% residual vol (Appraisal Ratio = 0.75), borrowing on margin at 2x leverage turns Fund X into +3.0% alpha with 4% residual vol—doubling Jensen’s Alpha via pure leverage without adding a single basis point of true skill!
How do I calculate Treynor-Black optimal capital allocation weight for an active satellite fund?
Treynor & Black (1973) proved that the optimal weight allocated to active portfolio A relative to passive market index M is proportional to (alpha_A / sigma_epsilon_A^2) divided by (E[R_M - r_f] / sigma_M^2)—literally the active Appraisal Ratio divided by residual vol relative to market price of risk!
What is "Downside M-Squared" (or Sortino M2)?
Analogous to standard M^2, Sortino-adjusted M^2 scales portfolio leverage to match the benchmark’s Target Downside Deviation TDD_m rather than total volatility sigma_m: M^2_Sortino = tau + Sortino_p * TDD_m, expressing convex downside-adjusted outperformance in annual percentage points.
Publication record
- Published
- 13 November 2026
- Updated
- 14 November 2026
- Author
- Elena Rostova, FRM, CQF
- Review
- Review not recorded
- Automated fact check
- Passed in the stored pipeline record
- Source URLs
- 4 recorded
AI assistance recorded: anthropic/claude-opus-4.6. This field does not establish human review or source verification.
Academic & Institutional Attribution
Cite This Research & Embed Live Data Card
Standard academic & institutional research paper citation format.
Elena Rostova, FRM, CQF. (2026, November 14). Treynor Ratio, Jensen’s Alpha & Modigliani M-Squared (M2) Leverage Math. QuantCalc Tools. https://quantcalctools.com/guides/treynor-ratio-jensens-alpha-m-squared-modigliani-leverage-mathRelated Cagr Irr Drawdown Compounding & Institutional Briefings
Explore Cagr Irr Drawdown Compounding Hub (20) →Cagr Irr Drawdown Compounding
CAGR vs IRR, Volatility Drag, Sharpe/Sortino & Drawdown Recovery: 2026 GuideCagr Irr Drawdown Compounding
Continuous Log Returns vs Simple Returns: Time Additivity vs Asset WeightsCagr Irr Drawdown Compounding
Fisher Exact Real CAGR, Inflation & Annual Tax Drag Compounding MathCagr Irr Drawdown Compounding
Arithmetic vs Geometric Mean Return: 0.5*Sigma^2 Variance Drain DerivationCagr Irr Drawdown Compounding
TWRR (CAGR) vs MWRR (XIRR): Irregular Cashflow Timing Divergence MathCagr Irr Drawdown Compounding
XIRR Newton-Raphson Convergence, Descartes Multiple Roots & MIRR MathCagr Irr Drawdown Compounding
Asymmetric Drawdown Recovery Hyperbola & Breakeven Compounding Time MathCagr Irr Drawdown Compounding
Sharpe Ratio IID Annualization Trap & Lo (2002) Autocorrelation HaircutKelly Margin Leverage Sizing
Black-Litterman Posterior Expected Return & Bayesian Kelly Sizing MathKelly Margin Leverage Sizing
Guaranteed Stop-Loss Order (GSLO) Premium vs Gap Slippage & Option MathMarket Insights
Cboe Global Markets (CBOE) Earnings Strength Keeps Valuation Debate In Focus - Yahoo FinanceRegulatory Compliance
Financial Stability Board to launch hedge fund leverage data consultation - Traders Union
QuantCalc Tools Data, Benchmarks & Contributor Records
CC BY 4.0 Open Data
Open Institutional Datasets (CSV / JSON) →
Download desk-compiled quantitative series & schemas.
2026 Reference Matrix
2026 Institutional Benchmarks & Thresholds →
Statutory capital, clearing, margin & rate conventions.
Editorial Records
Authors & Review Records →
View named contributors where those records are available.
Complete Index
Master Research & Dossier Archive →
Browse all published briefings by topic pillar & date.