
TIPS Real-Yield Duration vs Nominal Treasury Empirical Beta Hedging Math
Hedging $100M of 10-year TIPS 1-for-1 with nominal 10-year Treasuries over-hedges interest-rate risk by ~38% because real yields move only ~0.62 bps per 1.00 bp move in nominal yields.
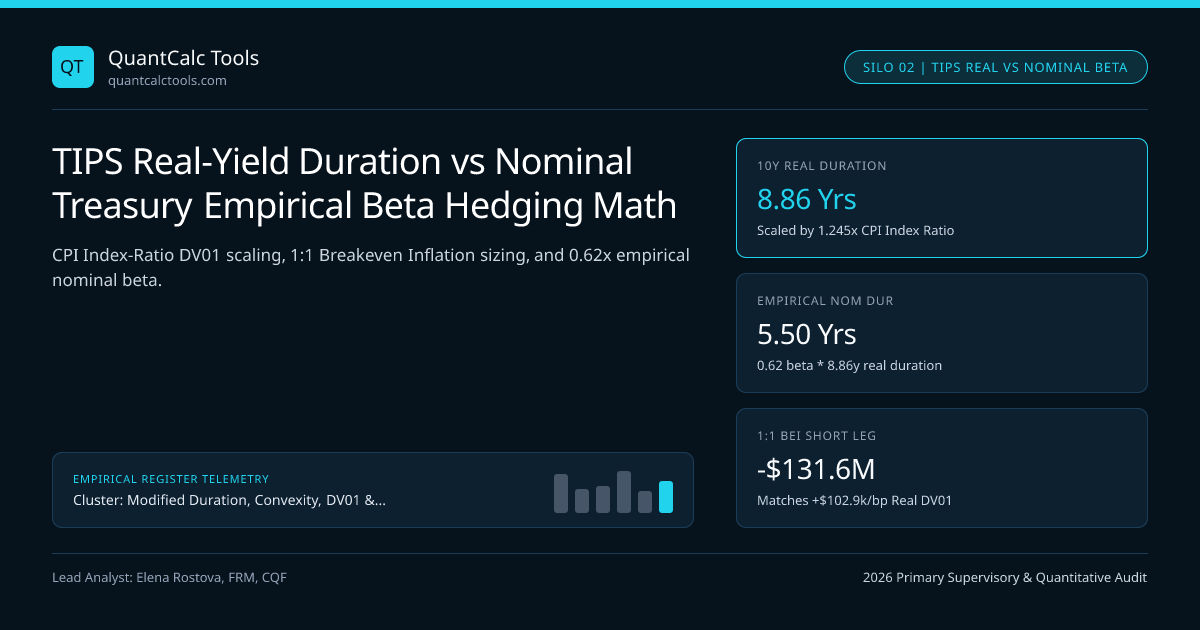
Why did multi-asset portfolios that hedged $$100\text{M}$ of 10-year US Treasury Inflation-Protected Securities (TIPS) dollar-for-dollar with $$100\text{M}$ of nominal 10-year Treasury futures suffer massive tracking errors during both the 2020 deflation crash and the 2022 inflation surge? Because analytical Real-Yield Modified Duration ($D_{\text{real}}$) measures sensitivity to real yields $r$, whereas nominal Treasury futures respond to nominal yields $y = r + \pi^e + \text{IRP}$! Anchor baseline Macaulay Duration, Modified Duration & Second-Order Convexity in our Modified Duration, Convexity & DV01 master guide.
Exact CPI Index-Ratio Invoice Scaling & Real-Yield Dollar DV01#
Every US TIPS (and Canadian Real Return Bond or Eurozone OATi) scales unadjusted real par principal and semiannual real coupons by the daily CPI-U Index Ratio $IR{\text{settle}} = \text{Ref CPI}{\text{settle}} / \text{Ref CPI}{\text{issue}}$ (with a 3-month linear interpolation lag). Discounting real cashflows at real yield $r$ produces unadjusted real clean price $P{\text{real}}(r)$, real accrued $AI{\text{real}}$, and Inflation-Adjusted Dirty Invoice Value: $$P{\text{dirty}}^{\text{nom}} = \left(P{\text{real}}(r) + AI{\text{real}}\right) \times IR{\text{settle}}, \qquad DV01{\text{real}} = P{\text{dirty}}^{\text{nom}} \times D{\text{mod,real}} \times 10^{-4}$$ Notice two immediate traps:
- Because TIPS pay lower real coupons ($0.125\%\text{ to }2.125\%$) than $4.40\%$ nominal Treasuries, 10-year TIPS analytical $D{\text{mod,real}} \approx 8.85$ years is LONGER than a 10-year nominal bond's $D{\text{mod,nom}} \approx 7.82$ years!
- Omitting $IR_{\text{settle}}$ (which exceeds $1.3200$ on seasoned TIPS issued a decade ago!) understates true real-yield dollar DV01 by $32\%$!
Empirical Nominal Yield Beta ($\beta_{r,y}$) & Breakeven Inflation Isolation#
By the Fisher decomposition $y{\text{nom}} = r{\text{real}} + BEI$ (where $BEI$ is 10-year Breakeven Inflation), regressing daily real-yield changes on nominal-yield changes ($\Delta rt = \alpha + \beta{r,y}\,\Delta yt + \epsilont$) yields the Empirical Nominal Duration: $$D{\text{emp,nom}} = \beta{r,y} \times D{\text{mod,real}}, \qquad \beta{r,y} = \frac{\text{Cov}(\Delta r, \Delta y)}{\text{Var}(\Delta y)} = 1 - \beta_{BEI, y}$$
- Market Inputs:
- Seasoned 10Y TIPS: Real Coupon = 1.250%, Real YTM r = 2.050%, Real Clean = 92.840, AI_real = 0.410
- Cumulative CPI Index Ratio IR_settle = 1.24500 (24.5% accrued CPI uplift since issuance!)
- Analytical Real Modified Duration Dmodreal = 8.8640 yrs
- 10-Year On-the-Run Nominal Treasury: YTM y = 4.400%, Dirty Price = 100.00, Dmodnom = 7.8200 yrs
- Rolling 1-Year OLS Beta of 10Y Real Yield on 10Y Nominal Yield: beta_{r,y} = 0.6200 (BEI beta = 0.3800)
- 1) Exact Inflation-Adjusted Dirty Market Value & Real-Yield DV01:
- Adjusted Dirty Market Value = $100,000,000 * (0.92840 + 0.00410) * 1.24500 = $116,096,250!
- Analytical Real-Yield DV01 = $116,096,250 * 8.8640 * 0.0001 = $102,907.72 per bp of REAL yield!
- 2) Minimum-Variance Nominal Treasury Hedge (Hedging Unhedged Rate Risk in Multi-Asset Book):
- Empirical Nominal DV01 = beta{r,y} * RealDV01 = 0.6200 * $102,907.72 = $63,802.79 per bp of NOMINAL yield!
- Required Short 10Y Nominal = $63,802.79 / ($7,820 per $10M) = $81,589,246 Short Nominal 10Y!
- (Naive 1:1 Real-DV01 hedge shorts $131.60M nominal -> OVER-HEDGES by +$50.01M / +61.3%!)
- 3) Pure 10-Year Breakeven Inflation (BEI = y - r = 2.35%) Trade Sizing:
- To isolate +$102,908/bp of pure BEI = (ynom - rreal) WITHOUT beta weighting:
- Long $100M Face TIPS (Real DV01 = +$102,908/bp) + Short $131,595,550 Nominal 10Y (Nom DV01 = -$102,908/bp)!
- Check: If Nominal rises +20bp and Real stays flat (+20bp BEI widening) => Profit = +$2,058,154!
Look at why distinguishing Goal #2 (Minimum-Variance Rate Hedge: short $$81.59\text{M}$) from Goal #3 (Pure Breakeven Inflation Trade: short $$131.60\text{M}$) is mandatory on institutional macro desks:
- If you want pure Breakeven Inflation ($y - r$), you match 100% of Real DV01 against Nominal DV01 ($$102.9\text{k/bp}$ each).
- If you hold TIPS inside an endowment and want minimum-variance protection against nominal bond selloffs, you scale by $\beta_{r,y} = 0.62$—because historically $38\%$ of nominal yield rises come from expanding inflation expectations (which lift TIPS CPI accruals rather than hurting TIPS prices)!
Embedded Deflation Floor Convexity & Seasonality Carry Distortions#
Two structural features make TIPS nonlinear relative to zero-coupon inflation swaps:
- Embedded $0\%$ Maturity Deflation Put ($IRT^{\text{redemption}} = \max(1.00000, IRT)$): Newly issued "on-the-run" TIPS with $IR0 \approx 1.005$ sit right at the strike of the US Treasury's maturity deflation floor! In a deflationary bust (like October 2008 or March 2020), newly issued TIPS enjoy extra positive convexity over seasoned TIPS ($IR0 = 1.32$, whose floor is $24\%$ out-of-the-money)!
- Non-Seasonally Adjusted CPI Carry: Because TIPS index to NSA CPI-U (
CUUR0000SA0), spring gasoline/apparel seasonality boosts March–June CPI carry while autumn drags September–December carry—creating huge 1-to-3-month repo breakeven swings modeled alongside our SOFR overnight compounding & carry calculator.
Regime Shifts in Real-to-Nominal Yield Beta ($\beta_{r,y}$) Across Macro Cycles#
| Macro Inflation Regime | Typical Correlation $\rho(\Delta r, \Delta BEI)$ | Empirical Beta $\beta_{r,y}$ | Empirical Nominal Duration (10Y TIPS) | Optimal Hedge Ratio per $100k Real DV01 |
|---|---|---|---|---|
| Demand-Driven Cycle (2010–2019) | $+0.45$ (Pro-cyclical inflation) | $0.55$ | $4.88$ yrs | Short $$55.0\text{k/bp}$ Nominal 10Y |
| Deflation / Liquidity Panic (Mar 2020) | $-0.72$ (Real spikes as BEI crashes!) | $1.35$ | $11.97$ yrs! | Nominal hedge FAILS (Real & Nom diverge) |
| Central Bank Supply-Shock Tightening (2022) | $+0.15$ (Aggressive FOMC hikes) | $0.82$ | $7.27$ yrs | Short $$82.0\text{k/bp}$ Nominal 10Y |
| Full-Cycle Multi-Decade Average | $+0.28$ | $0.62$ | $5.50$ yrs | Short $$62.0\text{k/bp}$ Nominal 10Y |
Reconciling Real Return Compounding & Sovereign Linker Conventions#
Notice UK Index-Linked Gilts (Linkers) issued since 2005 use a 3-month RPI/CPIH lag (older Linkers used an 8-month lag!) and carry NO $0\%$ maturity deflation floor—giving UK Linkers up to 45-year real duration on ultra-long issues! Connect real compounding math with our CAGR calculator, compare dirty invoice scaling in DV01 clean vs dirty bond price scaling, inspect extreme linker curvature in ultra-long 50Y Gilt and 100Y bond convexity math, and explore the Modified Duration & Key-Rate Hedging Topic Hub.
Frequently asked questions
Why did TIPS lose 12%+ in 2022 when US CPI inflation surged above 8%?
TIPS protect against UNEXPECTED inflation changes, but still carry long real-yield duration (~8.86 years on 10Y TIPS). When the Federal Reserve hiked aggressively in 2022, 10-year real yields jumped +260 bps (from -1.05% to +1.55%), imposing -22% real-duration price losses that exceeded +8% CPI accrual!
What is the difference between Real Duration and Empirical Duration on Bloomberg YAS for TIPS?
Real Duration (~8.86y) is the exact mathematical derivative with respect to the TIPS real yield. Empirical Duration (~5.5y) multiplies Real Duration by the historical regression beta of real yields on nominal yields (~0.62) to estimate portfolio sensitivity to nominal rate moves.
Why do newly issued TIPS trade at a lower real yield than seasoned TIPS maturing in the exact same month?
A newly issued TIPS has an Index Ratio near 1.00, placing its maturity 0% deflation floor right at-the-money. A 10-year-old TIPS maturing the same month has an Index Ratio near 1.30—meaning CPI would have to fall -23% cumulatively before its principal floor kicks in!
Why does TIPS CPI indexation use a 3-month lag instead of current-month inflation?
The Bureau of Labor Statistics publishes monthly CPI-U mid-way through the following month. Using a 3-month interpolation lag (t-3 and t-2 CPI levels) guarantees that every single settlement day’s exact Index Ratio is known deterministically in advance!
Publication record
- Published
- 14 November 2026
- Updated
- 15 November 2026
- Author
- Elena Rostova, FRM, CQF
- Review
- Review not recorded
- Automated fact check
- Passed in the stored pipeline record
- Source URLs
- 3 recorded
AI assistance recorded: anthropic/claude-opus-4.6. This field does not establish human review or source verification.
Academic & Institutional Attribution
Cite This Research & Embed Live Data Card
Standard academic & institutional research paper citation format.
Elena Rostova, FRM, CQF. (2026, November 15). TIPS Real-Yield Duration vs Nominal Treasury Empirical Beta Hedging Math. QuantCalc Tools. https://quantcalctools.com/guides/tips-real-yield-duration-vs-nominal-treasury-inflation-beta-mathRelated Bond Duration Convexity Math & Institutional Briefings
Explore Bond Duration Convexity Math Hub (20) →Bond Duration Convexity Math
Modified Duration, Convexity, DV01 & Key-Rate Hedging: 2026 Quantitative GuideBond Duration Convexity Math
Spread Duration vs Duration-Times-Spread (DTS): Credit Hedging MathBond Duration Convexity Math
Floating-Rate Note (FRN) Interest-Rate Reset Duration vs Spread Duration MathBond Duration Convexity Math
Ultra-Long 50Y Gilt & 100Y Century Bond Convexity Asymmetry MathBond Duration Convexity Math
Principal Component Analysis (PCA) Level, Slope & Curvature DV01 Hedging MathBond Duration Convexity Math
Pull-to-Par Horizon Return, Reinvestment Yield & Macaulay Duration Gap MathBond Duration Convexity Math
Macaulay vs Modified vs Effective Duration: Semiannual & ICMA Yield MathBond Duration Convexity Math
DV01 & PVBP Formula: Why Dirty Invoice Price Scales Dollar DurationCovered Interest Parity Forwards
USD/CAD T+1 Spot Lag, Modified Following & End-of-Month FX Calendar MathCovered Interest Parity Forwards
FX Time-Option (Window) Forward Pricing: Worst-Case Swap Point Rule MathCovered Interest Parity Forwards
Mark-to-Market (MTM) Resetting Cross-Currency Basis Swap Notional MathCovered Interest Parity Forwards
Basel SA-CCR & ISDA SIMM v2.6 FX Forward Margin & Capital Drag Math
QuantCalc Tools Data, Benchmarks & Contributor Records
CC BY 4.0 Open Data
Open Institutional Datasets (CSV / JSON) →
Download desk-compiled quantitative series & schemas.
2026 Reference Matrix
2026 Institutional Benchmarks & Thresholds →
Statutory capital, clearing, margin & rate conventions.
Editorial Records
Authors & Review Records →
View named contributors where those records are available.
Complete Index
Master Research & Dossier Archive →
Browse all published briefings by topic pillar & date.