
Constant-Weight Rebalancing Bonus & Shannon Demon Dispersion Math
Two volatile assets that each compound at 0.00% standalone geometric CAGR can generate +6.07% annualized CAGR when rebalanced 50/50; derive exact Booth-Fama dispersion harvesting math.
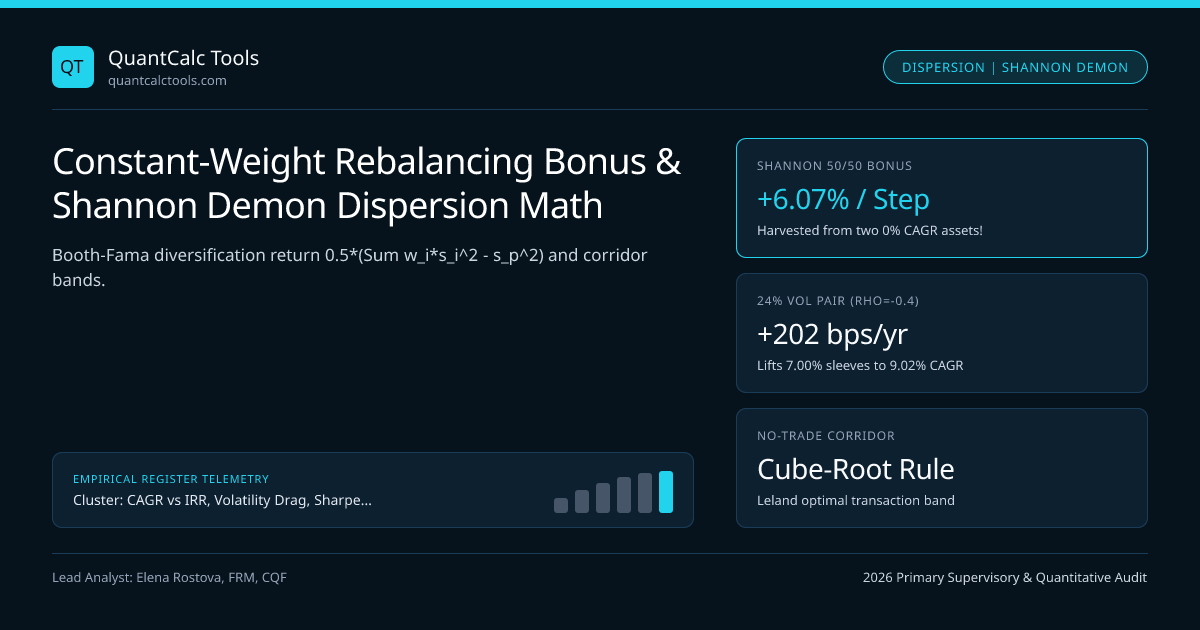
Information-theory pioneer Claude Shannon famously stunned an MIT lecture audience by demonstrating how an investor can generate positive, compounding exponential wealth from a risky asset whose long-run price goes nowhere at all (0.00% standalone geometric CAGR)! Known today as Shannon's Demon—and generalized to $N$-asset institutional portfolios by David Booth and Eugene Fama (1992) as Diversification Return and by Robert Fernholz (2002) as *Stochastic Portfolio Theory excess growth $\gamma^$**—constant-weight rebalancing systematically converts individual asset variance drain back into positive portfolio CAGR! Test geometric growth rates in our CAGR & Volatility Drag Calculator, optimize sizing in the Kelly Criterion Calculator, and explore our CAGR, IRR & Drawdown Hub.
Exact Derivation: Booth & Fama (1992) Rebalancing Bonus ($\gamma^*$)#
Recall from arithmetic vs geometric variance drain that asset $i$'s standalone geometric growth rate is $gi \approx \mui - \frac{1}{2}\sigmai^2$. In a continuously (or periodically) rebalanced portfolio with fixed target weights $w = (w1, \dots, wN)$ where $\sum wi = 1$, portfolio arithmetic return is the weighted average $\mup = \sum wi \mui$, while portfolio variance is $\sigmap^2 = w^\top \Sigma w < \sum wi \sigmai^2$ (strictly smaller whenever correlation $\rho{ij} < 1$). Substituting $\mui = gi + \frac{1}{2}\sigmai^2$ into $gp \approx \mup - \frac{1}{2}\sigma_p^2$ yields a breathtaking algebraic cancellation:
- Portfolio Geometric CAGR : gp ~= Sum{i=1..N} (wi * gi) + gamma*
- Excess Growth Rate : gamma* = 0.5 * [ Sum{i=1..N} (wi * sigmai^2) - sigmap^2 ]
- Two-Asset Special Case : gamma* = 0.5 * w1 * w2 * (sigma1^2 + sigma2^2 - 2 * rho * sigma1 * sigma2)
- = 0.5 * w1 * w2 * Var(R1 - R2) (Half the cross-sectional return dispersion!)
- Worked Proof of Claude Shannon's Demon (50% Cash at 0% + 50% Coin-Flip Stock):
- Each period, Stock either DOUBLES (+100%, x2.0) or HALVES (-50%, x0.5) with 50/50 probability:
- 1. Buy-and-Hold Stock CAGR : sqrt(2.0 * 0.5) - 1 = sqrt(1.00) - 1 = 0.00% / period! (Goes nowhere!)
- 2. Buy-and-Hold Cash CAGR : 0.00% / period! (Weighted average of standalone CAGRs = 0.00%!)
- 3. Rebalanced 50/50 Portfolio EVERY Period:
- Win period (+100% stock, 0% cash) : 0.5(+100%) + 0.5(0%) = +50.0% (x1.50) -> Rebalance back to 50/50!
- Loss period (-50% stock, 0% cash) : 0.5(-50%) + 0.5(0%) = -25.0% (x0.75) -> Rebalance back to 50/50!
- Two-Period Compound Factor = 1.50 * 0.75 = 1.125 (+12.5% per 2 steps) => Exact g_p = sqrt(1.125) - 1 = +6.066% / period!
Stop and marvel at Shannon's Demon: Asset 1 has $0.00\%$ CAGR, Asset 2 has $0.00\%$ CAGR, yet rebalancing 50/50 between them compounds wealth deterministically at $+6.07\%$ per period! No magic violated conservation of energy: the coin-flip stock actually had a positive arithmetic expected return ($0.5(+100\%) + 0.5(-50\%) = +25.0\%$) that was $100\%$ eaten alive by standalone variance drain ($\sigma \approx 75\%$). Holding $50\%$ cash slashed portfolio volatility in half, cutting variance drain by three-quarters ($0.5^2 = 0.25$) while keeping half (+12.5%) of the arithmetic return!
When Rebalancing HURTS Terminal Wealth: Momentum Trends & Divergence Risk#
Before mechanically rebalancing every asset to equal weights, institutional quants check two crucial caveats (Willenbrock 2011; Granger et al. 2014):
- *Rebalancing Beats the Weighted Average* of CAGRs, NOT Necessarily the Single Best Drift Asset! If Asset A compounds at $+12\%$ CAGR (
8%vol) and Asset B compounds at $+1\%$ CAGR (6%vol), a tiny $+18\text{ bps}$ rebalancing bonus cannot compensate for diluting $+12\%$ equity growth into $+1\%$ dead-weight cash—buy-and-hold drifts toward $85\%$ Asset A and wins in total dollars! Rebalancing shines brightest across assets with similar long-run geometric CAGRs, high standalone volatilities, and low/negative correlation** (modeled in our Cholesky Multi-Asset Simulator). - Serial Autocorrelation (
TrendingvsMean-Reverting): Daily rebalancing during a sustained multi-month momentum trend sells winners too early and averages down into crashing losers! Rebalancing at quarterly/annual horizons or corridor tolerance bands ($\pm 5\%$ relative weight drift) avoids intraday bid-ask bleed and rides intermediate momentum before mean-reversion kicks in.
Two-Asset Dispersion Harvest Schedule Across Pairwise Correlations#
Measure exact Booth-Fama excess CAGR $\gamma^*$ harvested by 50/50 rebalancing as pairwise correlation drops from $+1.0$ to $-0.8$:
| Two-Asset 50/50 Portfolio ($\sigma1 = 24\%$, $\sigma2 = 24\%$, Standalone $g1 = g2 = 7.0\%$) | Correlation ($\rho_{12}$) | Portfolio Vol ($\sigma_p$) | Rebalancing Bonus ($\gamma^*$) | Rebalanced Portfolio CAGR ($g_p$) |
|---|---|---|---|---|
| Perfectly Correlated Clones | $+1.00$ | $24.00\%$ | $+0\text{ bps}$ ($0.00\%$) | $7.00\%$ (Zero benefit) |
| High-Beta Equity Peers | $+0.70$ | $22.13\%$ | $+43\text{ bps}$ ($+0.43\%$) | $7.43\%$ |
| Uncorrelated Sleeves (Eq / CTA) | $0.00$ | $16.97\%$ | $+144\text{ bps}$ ($+1.44\%$) | $8.44\%$ |
| Crisis-Hedging Pair (Eq / Long Bond) | $-0.40$ | $13.27\%$ | $+202\text{ bps}$ ($+2.02\%$) | $9.02\%$ |
| Perfect Mirror Hedges | $-0.80$ | $7.59\%$ | $+259\text{ bps}$ ($+2.59\%$) | $9.59\%$ |
Deep Mathematical Duality: Rebalancing Bonus ($0 < w < 1$) vs Leveraged ETF Decay ($L > 1$)#
Notice that constant-weight rebalancing with $w1 = 0.50$ and daily leveraged ETF resetting with $L = 3.0$ obey the exact same Ito's Lemma formula $g(w) = w\mu + (1-w)rf - \frac{1}{2}w^2\sigma^2$:
- When $0 < w < 1$ (diversified rebalancing), $w - w^2 = w(1-w) > 0$, producing a positive variance harvest $+\frac{1}{2}w(1-w)\sigma^2$!
- When $w = L > 1$ (leveraged daily reset) or $w < 0$ (inverse ETF), $w(1-w) < 0$, flipping the exact same term into negative volatility decay $-\frac{1}{2}L(L-1)\sigma^2$—derived in full in our companion guide daily leveraged ETF beta slippage and volatility decay!
Practical Rebalancing Rules for Taxable and Institutional Accounts#
In taxable wealth accounts, realizing short-term capital gains to harvest $+100\text{ bps}$ of rebalancing bonus can cost $-140\text{ bps}$ in annual tax drag! Execute cashflow rebalancing first (routing dividends, coupons, and new deposits into underweight sleeves) across low-commission platforms in our broker lookup directory and compare matrix.
Frequently asked questions
Does rebalancing guarantee higher terminal wealth than a pure buy-and-hold portfolio?
Not always! Rebalancing guarantees beating the WEIGHTED AVERAGE of constituent standalone CAGRs (before costs), NOT beating an un-rebalanced drifting portfolio when one asset has a much higher true CAGR (e.g., equities at 10% vs cash at 3%), because buy-and-hold naturally drifts toward 90%+ in the higher-CAGR winner.
How does return autocorrelation affect optimal rebalancing frequency?
Positive short-term autocorrelation (1-to-6 month momentum) penalizes monthly rebalancing because winners keep winning; negative medium-term autocorrelation (1-to-3 year mean reversion) supercharges annual or +/-5% threshold rebalancing BEYOND the IID Booth-Fama formula!
Why does holding 50% cash in Shannon’s Demon work if cash earns 0%?
Because the risky asset in Shannon’s Demon has a high +25% arithmetic mean return crushed by a -25% standalone variance drain (0.5 * sigma^2). Scaling risky weight to w = 0.5 cuts arithmetic return linearly by 50% (to +12.5%) while cutting variance quadratically by 75% (to -6.25%), unlocking +6.07% net CAGR—which is literally Continuous Kelly optimal sizing!
How do transaction costs and bid-ask spreads enter the rebalancing bonus equation?
Net excess growth equals gamma* minus (Two-Way Turnover * Half-Spread + Realized Tax Drag). Under tolerance-band rebalancing with width delta, expected turnover scales with sigma^2 / delta^2, which Leland (1999) proved has a cube-root optimal no-trade zone proportional to (cost * sigma^2)^(1/3).
Publication record
- Published
- 13 November 2026
- Updated
- 14 November 2026
- Author
- Elena Rostova, FRM, CQF
- Review
- Review not recorded
- Automated fact check
- Passed in the stored pipeline record
- Source URLs
- 4 recorded
AI assistance recorded: anthropic/claude-opus-4.6. This field does not establish human review or source verification.
Academic & Institutional Attribution
Cite This Research & Embed Live Data Card
Standard academic & institutional research paper citation format.
Elena Rostova, FRM, CQF. (2026, November 14). Constant-Weight Rebalancing Bonus & Shannon Demon Dispersion Math. QuantCalc Tools. https://quantcalctools.com/guides/constant-weight-rebalancing-bonus-shannon-demon-dispersion-mathRelated Cagr Irr Drawdown Compounding & Institutional Briefings
Explore Cagr Irr Drawdown Compounding Hub (20) →Cagr Irr Drawdown Compounding
CAGR vs IRR, Volatility Drag, Sharpe/Sortino & Drawdown Recovery: 2026 GuideCagr Irr Drawdown Compounding
Daily Leveraged ETF Beta Slippage & Volatility Decay Math (2x, 3x, -1x)Cagr Irr Drawdown Compounding
Information Ratio, Tracking Error & Grinold-Kahn Fundamental Law MathCagr Irr Drawdown Compounding
Expected Maximum Drawdown of Brownian Motion (Magdon-Ismail Drift Math)Cagr Irr Drawdown Compounding
Simple vs Modified Dietz Return Formula: Sub-Period Cashflow Weighting MathCagr Irr Drawdown Compounding
Hedge Fund 2-and-20 Fee Drag, High-Water Mark & Hurdle Net CAGR MathCagr Irr Drawdown Compounding
Treynor Ratio, Jensen’s Alpha & Modigliani M-Squared (M2) Leverage MathCagr Irr Drawdown Compounding
Continuous Log Returns vs Simple Returns: Time Additivity vs Asset WeightsKelly Margin Leverage Sizing
Inverse Coin-Margined vs Linear Dollar Perpetual Liquidation & Convexity MathKelly Margin Leverage Sizing
Volatility-Target, Wilder ATR Stop-Loss & Equal Risk Contribution SizingKelly Margin Leverage Sizing
Central Clearing Variation Margin Liquidity Spirals & Cash Buffer MathKelly Margin Leverage Sizing
Ralph Vince Optimal f & Terminal Wealth Relative (TWR): Empirical Sizing Math
QuantCalc Tools Data, Benchmarks & Contributor Records
CC BY 4.0 Open Data
Open Institutional Datasets (CSV / JSON) →
Download desk-compiled quantitative series & schemas.
2026 Reference Matrix
2026 Institutional Benchmarks & Thresholds →
Statutory capital, clearing, margin & rate conventions.
Editorial Records
Authors & Review Records →
View named contributors where those records are available.
Complete Index
Master Research & Dossier Archive →
Browse all published briefings by topic pillar & date.