
Zero-Coupon STRIPS Convexity Scaling: Quadratic Maturity Leverage Math
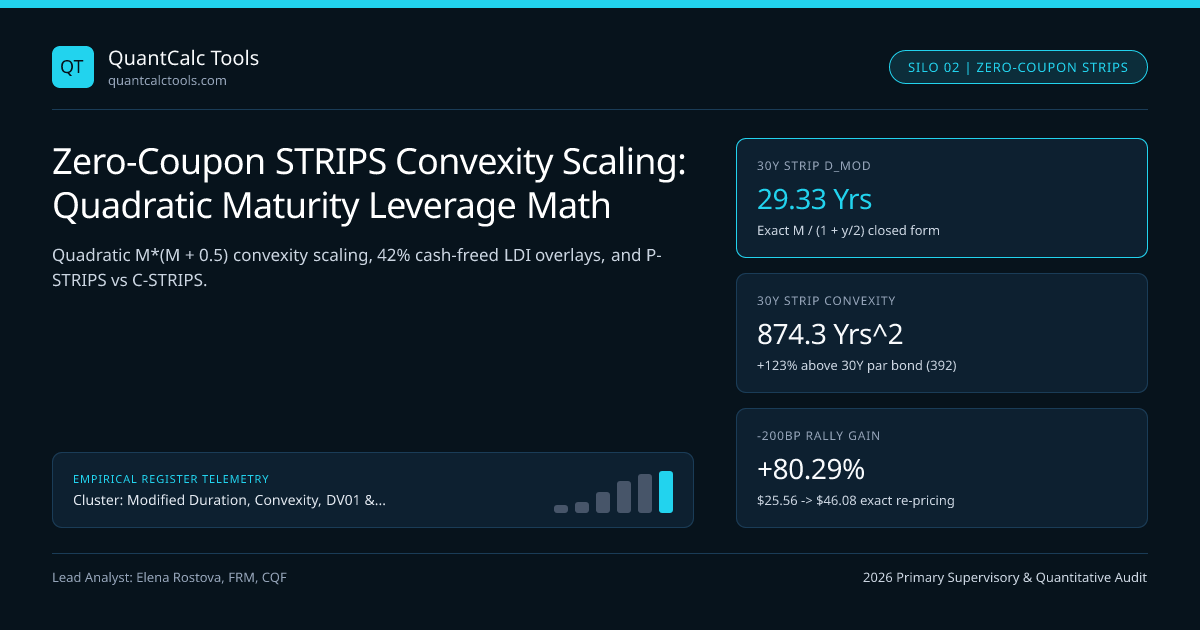
Stripping all intermediate coupons locks Macaulay Duration exactly to maturity M and scales convexity quadratically as M*(M + 0.5)/(1 + y/2)^2—making 30Y STRIPS more than twice as convex as 30Y par bonds.
Why did 25-to-30-year US Treasury Principal STRIPS (Separate Trading of Registered Interest and Principal of Securities) surge $+54\%$ in Q1 2020 during the COVID deflation shock while standard 30-year coupon Treasuries gained $+22\%$? Because intermediate coupons pull a par 30-year bond's center of gravity inward to $17.3$ years, whereas a zero-coupon STRIP concentrates $100\%$ of cashflow at $T = 30.0$ years—locking Macaulay Duration, Modified Duration & Second-Order Convexity directly to maturity $M$ and scaling convexity quadratically ($\propto M^2$)! Benchmark compound tail returns in our CAGR calculator and anchor core sensitivity identities in our Modified Duration, Convexity & DV01 master guide.
Exact Semiannual ICMA Pricing, Duration, and Quadratic Convexity of STRIPS#
Although US Treasury STRIPS pay zero coupons, market convention prices and quotes STRIPS on a semiannual compounding basis ($k = 2$, $n = 2M$ half-years) so yields compare apples-to-apples against coupon-bearing Treasuries: $$P{\text{STRIP}}(M, y) = \frac{100}{\left(1 + \frac{y}{2}\right)^{2M}} \implies D{Mac} = M, \quad D{mod} = \frac{M}{1 + y/2}, \quad C{\text{STRIP}} = \frac{2M(2M + 1)}{4\,(1 + y/2)^2} = \frac{M(M + 0.5)}{(1 + y/2)^2}$$ Notice two astonishing properties of these closed-form STRIP equations:
- Zero Yield Sensitivity of Macaulay Duration: Unlike a coupon bond whose $D{Mac}$ shrinks when yields rise, a STRIP's $D{Mac} \equiv M$ stays pinned at $30.00$ years regardless of whether yields are $1\%$ or $10\%$!
- $2.24\times$ Higher Convexity than a 30Y Par Bond: At $y = 4.60\%$, a 30-year par coupon bond has $D{mod} = 16.95$ years and $C = 392.0\text{ yrs}^2$, whereas a 30-year STRIP has $D{mod} = 29.326$ years ($1.73\times$ higher duration) and $C = 873.9\text{ yrs}^2$ ($2.23\times$ higher convexity)!
Worked $25M Capital-Efficient Deflation Hedge: 30Y STRIPS vs 30Y Par Bond#
- 1) 30-Year Zero-Coupon Principal STRIP ($25,000,000 Cash Outlay):
- Unit Price P_STRIP = 100 / (1 + 0.023)^60 = 25.5582 per $100 face => Buys $97,815,965 Face Value!
- Macaulay Duration = 30.0000 yrs; Modified Duration D_mod = 30 / 1.023 = 29.3255 yrs
- Dollar DV01 = $25,000,000 * 29.3255 * 0.0001 = $73,313.78 / bp!
- Exact Convexity C = [ 30 * (30 + 0.5) ] / (1.023)^2 = 915.0 / 1.046529 = 874.32 yrs^2!
- 2) Match Exact $73,314/bp DV01 Using 30-Year Par Coupon Treasuries (D_mod = 16.950 yrs, C = 392.0 yrs^2):
- Required Par Bond Cash = $73,313.78 / (16.950 * 0.0001) = $43,252,968!
- Capital Freed by STRIPS = $43,252,968 - $25,000,000 = +$18,252,968 (42.2% LESS CASH TIED UP!)
- 3) -200 bps Deflationary Crash Re-Pricing (y drops 4.60% -> 2.60%, Exact Closed-Form Price!):
- New STRIP Price = 100 / (1 + 0.013)^60 = 46.0798 (+80.2936% EXACT Percentage Surge!)
- > $25.00M STRIP Position Jumps to $45,073,400 => +$20,073,400 Profit!
- New $43.25M Par Bond Position (P_new = 139.88, +39.88% gain) => +$17,249,284 Profit!
- PURE CONVEXITY OUTPERFORMANCE AT IDENTICAL INITIAL DV01 = +$2,824,116 (+11.30% extra return on STRIP!)
Pause and admire Step 2 and Step 3: spending $$25.00\text{M}$ on 30Y STRIPS buys the exact same $$73,314/\text{bp}$ initial DV01 as $$43.25\text{M}$ of 30Y coupon bonds (freeing $$18.25\text{M}$ in unencumbered cash to deploy into equities or T-bills without touching repo margin!), and still beats the $$43.25\text{M}$ par bond book by $+$2.82\text{M}$ in a $-200\text{ bps}$ deflation shock because dollar convexity per unit of DV01 is $C/D_{mod} = 874.3 / 29.33 = 29.81$ vs $392.0 / 16.95 = 23.13$!
Principal STRIPS (P-STRIPS) vs Coupon STRIPS (C-STRIPS) & Phantom OID Tax#
Two institutional nuances govern live STRIPS execution:
- Reconstitution Optionality (
P-STRIPSvsC-STRIPS): Primary dealers can reconstitute a 30-year Treasury note only by combining that exact bond's Principal STRIP with 60 generic fungible Coupon STRIPS. During crisis flights-to-safety, Principal STRIPS often trade $4\text{ to }12\text{ bps}$ richer (lower yield) than identical-maturity Coupon STRIPS due to higher benchmark liquidity and reconstitution scarcity! - IRS / HMRC Phantom Tax (Original Issue Discount): In taxable accounts, constant-yield OID accretion is taxed annually as ordinary interest income even though zero cash is received, making tax-exempt pension plans, sovereign wealth funds, and LDI sleeves the natural holders!
Maturity Scaling Matrix: Zero-Coupon STRIPS vs Par Coupon Treasuries ($y = 4.50\%$)#
| Maturity ($M$) | STRIP Unit Price ($P$) | STRIP $D_{mod}$ (Yrs) | Par Bond $D_{mod}$ (Yrs) | STRIP Convexity ($C$) | Par Bond Convexity ($C$) |
|---|---|---|---|---|---|
| 2-Year ($M = 2$) | $91.48$ | $1.96$ yrs | $1.89$ yrs | $4.78\text{ yrs}^2$ | $4.50\text{ yrs}^2$ |
| 5-Year ($M = 5$) | $80.05$ | $4.89$ yrs | $4.41$ yrs | $26.30\text{ yrs}^2$ | $22.75\text{ yrs}^2$ |
| 10-Year ($M = 10$) | $64.08$ | $9.78$ yrs | $7.80$ yrs | $100.49\text{ yrs}^2$ | $73.10\text{ yrs}^2$ |
| 20-Year ($M = 20$) | $41.06$ | $19.56$ yrs | $13.08$ yrs | $392.18\text{ yrs}^2$ | $218.40\text{ yrs}^2$ |
| 30-Year ($M = 30$) | $26.32$ | $29.34$ yrs | $16.95$ yrs | $875.56\text{ yrs}^2$ | $392.00\text{ yrs}^2$ |
Eliminating Reinvestment Risk & Extending to 50Y/100Y Ultra-Long Debt#
Notice the fourth KPI above: STRIPS carry strictly $0.00\%$ coupon reinvestment risk—locking in exact realized horizon CAGR if held to maturity! Compare Taylor truncation residuals on extreme-convexity zeros in second-order bond convexity large-yield-shock error, push maturity out to 50Y Gilts and 100Y Austrian century bonds in ultra-long 50Y Gilt and 100Y bond convexity math, verify tail downside metrics in our Value-at-Risk calculator, and explore the Modified Duration & Key-Rate Hedging Topic Hub.
Frequently asked questions
Why are US Treasury STRIPS priced with semiannual compounding (k = 2) when they pay zero semiannual coupons?
US Treasury market convention quotes STRIPS yields using 2*M semiannual compounding periods so traders can directly compare STRIP yields against semiannual par Treasury yields and bootstrap spot curves without a compounding-frequency basis gap.
Why does a 20-year STRIP have the exact same convexity (~392 years^2) as a 30-year par coupon bond?
Because 60 semiannual coupon payments return over half of a 30-year par bond’s present value well before year 30, dragging its effective duration down to 16.95 years and its convexity down to 392—matching a pure 20-year zero-coupon STRIP!
What is the difference between a Principal STRIP (Corpus) and a Coupon STRIP maturing on the exact same date?
Both pay $100 at the identical maturity date, but only a bond’s specific Principal STRIP can reconstitute that on-the-run or CTD bond, whereas Coupon STRIPS from different issues are fungible. Principal STRIPS often trade 3–10 bps richer in flight-to-quality rallies.
Why do multi-asset risk-parity and equity tail-hedge funds prefer 30Y STRIPS over 3x leveraged 10Y futures?
Unlike leveraged futures or repo (which suffer daily variation margin calls and negative financing carry when curves invert), unlevered 30Y STRIPS have strictly capped cash outlay (unit price ~26 cents on the dollar) and +875 years^2 of positive convexity!
Publication record
- Published
- 14 November 2026
- Updated
- 14 November 2026
- Author
- Elena Rostova, FRM, CQF
- Review
- Review not recorded
- Automated fact check
- Passed in the stored pipeline record
- Source URLs
- 3 recorded
AI assistance recorded: anthropic/claude-opus-4.6. This field does not establish human review or source verification.
Academic & Institutional Attribution
Cite This Research & Embed Live Data Card
Standard academic & institutional research paper citation format.
Elena Rostova, FRM, CQF. (2026, November 14). Zero-Coupon STRIPS Convexity Scaling: Quadratic Maturity Leverage Math. QuantCalc Tools. https://quantcalctools.com/guides/zero-coupon-strips-convexity-scaling-quadratic-maturity-leverageRelated Bond Duration Convexity Math & Institutional Briefings
Explore Bond Duration Convexity Math Hub (20) →Bond Duration Convexity Math
Modified Duration, Convexity, DV01 & Key-Rate Hedging: 2026 Quantitative GuideBond Duration Convexity Math
Par Swap DV01 vs Zero-Rate PV01: Jacobian Curve Transformation MathBond Duration Convexity Math
ACT/ACT ICMA vs 30/360 Accrued Interest & Odd-Stub Duration Bias MathBond Duration Convexity Math
TIPS Real-Yield Duration vs Nominal Treasury Empirical Beta Hedging MathBond Duration Convexity Math
Spread Duration vs Duration-Times-Spread (DTS): Credit Hedging MathBond Duration Convexity Math
Floating-Rate Note (FRN) Interest-Rate Reset Duration vs Spread Duration MathBond Duration Convexity Math
Ultra-Long 50Y Gilt & 100Y Century Bond Convexity Asymmetry MathBond Duration Convexity Math
Principal Component Analysis (PCA) Level, Slope & Curvature DV01 Hedging MathCovered Interest Parity Forwards
Continuous Garman-Kohlhagen vs Discrete Money-Market CIP FX Options MathCovered Interest Parity Forwards
Synthetic USD Commercial Paper Funding: FX Swap Implied SOFR Spread MathCovered Interest Parity Forwards
Currency-Hedged Foreign Sovereign Bond Yield Pickup: 3M Rolling FX Swap MathCovered Interest Parity Forwards
USD/CAD T+1 Spot Lag, Modified Following & End-of-Month FX Calendar Math
QuantCalc Tools Data, Benchmarks & Contributor Records
CC BY 4.0 Open Data
Open Institutional Datasets (CSV / JSON) →
Download desk-compiled quantitative series & schemas.
2026 Reference Matrix
2026 Institutional Benchmarks & Thresholds →
Statutory capital, clearing, margin & rate conventions.
Editorial Records
Authors & Review Records →
View named contributors where those records are available.
Complete Index
Master Research & Dossier Archive →
Browse all published briefings by topic pillar & date.