
Information Ratio, Tracking Error & Grinold-Kahn Fundamental Law Math
Institutional benchmark mandates judge active managers on Information Ratio rather than raw Sharpe; derive exact Tracking Error decomposition and the Clarke-de Silva-Thorley Transfer Coefficient law.
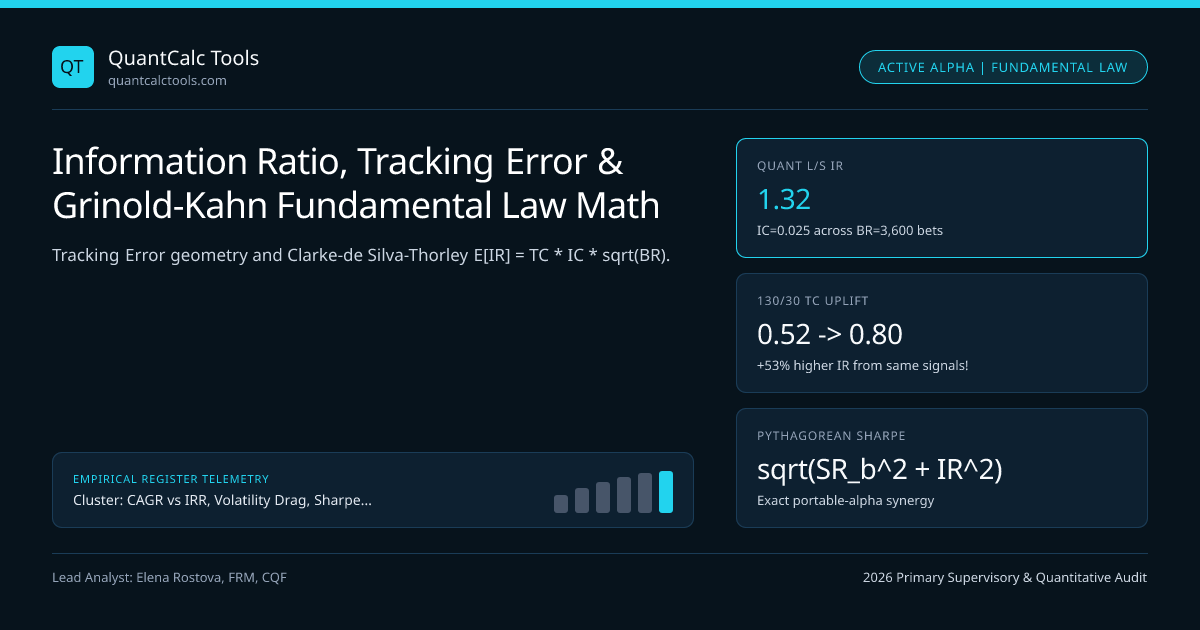
When a pension board hires a US Large-Cap Growth equity manager benchmarked against the Russell 1000 Growth Index, rewarding that manager via the Sharpe Ratio makes a basic attribution mistake: $92\%$ of the portfolio's Sharpe Ratio comes simply from passive equity market beta rather than active security selection! Institutional asset owners isolate pure manager value-added using the Information Ratio (IR)—active excess return over the benchmark divided by Tracking Error (TE)—and engineer systematic alpha engines using Richard Grinold and Ronald Kahn's (1999) Fundamental Law of Active Management, extended by Clarke, de Silva & Thorley (2002) for real-world long-only and turnover constraints. Compare total vs active ratios in our Sharpe & Sortino Calculator and CAGR, IRR & Drawdown Hub.
Exact Information Ratio, Active vs Regression Alpha, and the Fundamental Law#
Distinguish carefully between Benchmark-Relative IR (used by GIPS institutional consultants, where active return $R{a,t} = R{p,t} - R{b,t}$ assumes $\betap = 1$) and CAPM / Factor Appraisal Ratio (Treynor-Black 1973, where $\alphap = R{p,t} - rf - \betap(R{b,t} - rf)$ strips out hidden beta tilt!). Why does that distinction matter? Because a "closet beta" manager who holds $1.20\times$ index beta during a $+20\%$ bull market prints $+4.0\%$ naive active return (R_p - R_b), whereas regression Appraisal Ratio immediately exposes $\alpha_p = 0.0\%$!
- Active Weight Vector : Deltaw = wp - wb (Sums to 0: Sum Deltaw_i = 0)
- Ex-Ante Tracking Error : TE = sqrt( Deltaw^T * Sigma * Deltaw )
- Ex-Post Information Ratio: IR = mean(Rp - Rb) / std(Rp - Rb) * sqrt(q) [Appraisal Ratio uses regression residual e_t]
- Grinold-Kahn (1999) & Clarke-de Silva-Thorley (2002) Extended Fundamental Law:
- Expected Information Ratio: E[IR] = TC * IC * sqrt(BR)
- Expected Active Return : E[R_a] = TC * IC * sqrt(BR) * TE
- IC (Information Coefficient) : Cross-sectional rank/Pearson correlation between alpha forecasts and realized residual returns
- BR (Breadth) : Number of INDEPENDENT active bets per year (Nstocks * Nrebalances adjusted for correlation)
- TC (Transfer Coefficient) : Corr( risk-adjusted forecasts, active weights ) in [0, 1] — measures constraint friction!
- Worked Comparison — Concentrated Fundamental Stockpicker vs Systematic Stat-Arb Pod:
- 1. Star Fundamental PM : High skill IC = 0.14, makes BR = 25 independent stock bets/yr, long-only TC = 0.72:
- E[IR] = 0.72 * 0.14 * sqrt(25) = 0.72 * 0.14 * 5.0 = 0.504 (Solid top-quartile fundamental IR!)
- 2. Quantitative Equity Pod: Tiny micro-edge IC = 0.025, trades 1,200 liquid stocks x 12 independent horizons (BR = 3,600),
- market-neutral long/short unconstrained TC = 0.88:
- E[IR] = 0.88 * 0.025 * sqrt(3,600) = 0.88 * 0.025 * 60.0 = 1.320! (+162% higher IR from tiny 2.5% correlation!)
Look at why quantitative equity pods dominate institutional risk-adjusted capital allocation: you do NOT need a crystal ball (IC = 0.20) to build an IR = 1.32 machine—a barely perceptible IC = 0.025 (51.25% directional hit rate!), applied consistently across $3{,}600$ independent cross-sectional bets per year with clean portfolio construction (TC = 0.88), compounds into top-decile institutional alpha!
Treynor-Black Orthogonal Geometry: $SRp^2 = SRb^2 + IR^2$#
How does active Information Ratio combine with passive benchmark Sharpe Ratio to determine total portfolio Sharpe? When active alpha is orthogonal to benchmark beta ($\beta{\text{active}} = 0$, achieved via futures overlay or beta-neutral active weights), Treynor & Black (1973) proved Pythagorean Sharpe Addition: $$\text{SR}{\text{optimal}}^2 = \text{SR}{\text{benchmark}}^2 + \text{IR}{\text{active}}^2$$ For example, overlaying a portable-alpha market-neutral fund with $\text{IR} = 1.00$ onto an S&P 500 futures benchmark with $\text{SR}_b = 0.50$ lifts optimal combined portfolio Sharpe from $0.50$ to $\sqrt{0.50^2 + 1.00^2} = \sqrt{1.25} =$ $1.118$!
Why Long-Only Constraints Slash the Transfer Coefficient (TC) on Narrow Benchmarks#
In a long-only mandate ($w{p,i} \ge 0$), the maximum underweight a manager can place on a hated stock is **$-w{b,i}$! In the S&P 500 or Russell 1000, the bottom $400$ stocks each have benchmark weights of just $0.02\%$ to $0.08\%$: even if your quant model screams a $-3.0\,\sigma$ sell signal on Stock #420 (w_b = 0.03%), a long-only fund can underweight it by at most $-3\text{ bps}$, wasting half of your negative Information Coefficient and crushing TC down to $\sim 0.45$! That exact constraint bottleneck gave birth to 130/30 Active Extension** strategies, which unlock $30\%$ shorting capacity to restore TC back toward $0.78\text{--}0.85$.
Active Mandate Architecture: Skill (IC), Breadth (BR) & Transfer Coefficient (TC)#
Trace how relaxing long-only shorting constraints unlocks active Information Ratio without changing underlying alpha signals:
| Active Strategy Structure | Typical Skill (IC) | Independent Bets (BR) | Transfer Coeff (TC) | Expected IR | Typical TE Budget |
|---|---|---|---|---|---|
| Closet Indexer (High Fee Trap) | $0.02$ | $30$ | $0.45$ | $0.05$ (Net negative!) | $1.2\%$ |
| Concentrated Long-Only Equity | $0.12$ | $30$ | $0.68$ | $0.45$ | $5.5\%$ |
| Systematic Long-Only Enhanced | $0.035$ | $600$ | $0.52$ | $0.45$ | $2.0\%$ |
| 130/30 Active Extension | $0.035$ | $600$ | $0.80$ | $0.69$ | $3.5\%$ |
| Market-Neutral Stat-Arb Pod | $0.025$ | $3{,}600$ | $0.88$ | $1.32$ | $6.0\%$ |
Statistical Significance of Information Ratio: $t\text{-stat} = \text{IR} \times \sqrt{T_{\text{years}}}$#
Never allocate to a $2$-year active track record solely because it shows an $\text{IR}$ of $0.60$: under IID active residuals, the $t$-statistic testing $H0: \text{IR}{\text{true}} = 0$ is remarkably simple: $$t = \widehat{\text{IR}} \times \sqrt{T_{\text{years}}}$$ Achieving $95\%$ one-sided statistical significance ($t \ge 1.645$) for a genuinely skilled $\text{IR} = 0.50$ long-only manager requires $T = (1.645 / 0.50)^2 =$ $10.82$ years of live outperformance! That is why institutional allocators supplement trailing IR with holdings-basedActive Share, Treynor, Jensen's Alpha, and M-squared attribution, and Deflated Sharpe multiple-testing checks across benchmarks and UK FCA disclosures.
Frequently asked questions
Why does buying 50 undervalued semiconductor stocks NOT give me Breadth BR = 50 in the Fundamental Law?
Breadth BR counts strictly INDEPENDENT bets! If 50 semiconductor picks are driven by one macro AI-capex cycle with 0.75 pairwise residual correlation, Buckle’s (2004) effective breadth formula BR_eff = N / [1 + (N - 1)*rho] collapses BR = 50 / [1 + 49*(0.75)] = 1.32 independent bets!
What is the difference between Benchmark Information Ratio and CAPM Appraisal Ratio?
Benchmark IR divides arithmetic/geometric active return (R_p - R_b) by Tracking Error std(R_p - R_b), implicitly assuming beta = 1.0. If a manager holds beta = 1.25 in a bull market, Benchmark IR looks artificially high, whereas Appraisal Ratio regresses R_p - r_f = alpha + beta*(R_b - r_f) + e and computes alpha / std(e).
How does Cremers & Petajisto’s Active Share complement Tracking Error when spotting closet indexers?
Active Share = 0.5 * Sum |w_{p,i} - w_{b,i}| measures holdings overlap, while Tracking Error measures factor volatility. A "closet indexer" holds Active Share < 60% and Tracking Error < 1.5% while charging an active 0.85% fee—mathematically guaranteeing a negative net-of-fee Information Ratio!
Does the Information Ratio suffer from a negative-numerator ranking flaw like the Sharpe Ratio?
Yes! When active return (R_p - R_b) is negative (say -2.0%), taking MORE Tracking Error (10% instead of 2%) raises standard IR from -1.00 to -0.20 (ranking the wild underperformer higher!). Institutional databases apply Israelsen’s modified exponent (R_p - R_b) / TE^(sign(R_p - R_b)) whenever active return < 0.
Publication record
- Published
- 13 November 2026
- Updated
- 14 November 2026
- Author
- Elena Rostova, FRM, CQF
- Review
- Review not recorded
- Automated fact check
- Passed in the stored pipeline record
- Source URLs
- 4 recorded
AI assistance recorded: anthropic/claude-opus-4.6. This field does not establish human review or source verification.
Academic & Institutional Attribution
Cite This Research & Embed Live Data Card
Standard academic & institutional research paper citation format.
Elena Rostova, FRM, CQF. (2026, November 14). Information Ratio, Tracking Error & Grinold-Kahn Fundamental Law Math. QuantCalc Tools. https://quantcalctools.com/guides/information-ratio-active-return-tracking-error-fundamental-lawRelated Cagr Irr Drawdown Compounding & Institutional Briefings
Explore Cagr Irr Drawdown Compounding Hub (20) →Cagr Irr Drawdown Compounding
CAGR vs IRR, Volatility Drag, Sharpe/Sortino & Drawdown Recovery: 2026 GuideCagr Irr Drawdown Compounding
Expected Maximum Drawdown of Brownian Motion (Magdon-Ismail Drift Math)Cagr Irr Drawdown Compounding
Simple vs Modified Dietz Return Formula: Sub-Period Cashflow Weighting MathCagr Irr Drawdown Compounding
Hedge Fund 2-and-20 Fee Drag, High-Water Mark & Hurdle Net CAGR MathCagr Irr Drawdown Compounding
Treynor Ratio, Jensen’s Alpha & Modigliani M-Squared (M2) Leverage MathCagr Irr Drawdown Compounding
Continuous Log Returns vs Simple Returns: Time Additivity vs Asset WeightsCagr Irr Drawdown Compounding
Fisher Exact Real CAGR, Inflation & Annual Tax Drag Compounding MathCagr Irr Drawdown Compounding
Arithmetic vs Geometric Mean Return: 0.5*Sigma^2 Variance Drain DerivationKelly Margin Leverage Sizing
Central Clearing Variation Margin Liquidity Spirals & Cash Buffer MathKelly Margin Leverage Sizing
Ralph Vince Optimal f & Terminal Wealth Relative (TWR): Empirical Sizing MathKelly Margin Leverage Sizing
Short Naked Option Margin Math: Reg T 20%/10% Rule & Gamma Crash ExpansionKelly Margin Leverage Sizing
Repo Haircut, Rehypothecation Multiplier & Leveraged Bond Carry Math
QuantCalc Tools Data, Benchmarks & Contributor Records
CC BY 4.0 Open Data
Open Institutional Datasets (CSV / JSON) →
Download desk-compiled quantitative series & schemas.
2026 Reference Matrix
2026 Institutional Benchmarks & Thresholds →
Statutory capital, clearing, margin & rate conventions.
Editorial Records
Authors & Review Records →
View named contributors where those records are available.
Complete Index
Master Research & Dossier Archive →
Browse all published briefings by topic pillar & date.