
Covered Interest Parity Forwards
Currency-Hedged Foreign Sovereign Bond Yield Pickup: 3M Rolling FX Swap Math
How can a 1.05% 10-year Japanese Government Bond pay 5.48% to a USD-hedged institutional investor—beating a 4.40% US Treasury by +108 bps? Unpack 3-month rolling FX swap carry plus steep foreign rolldown.
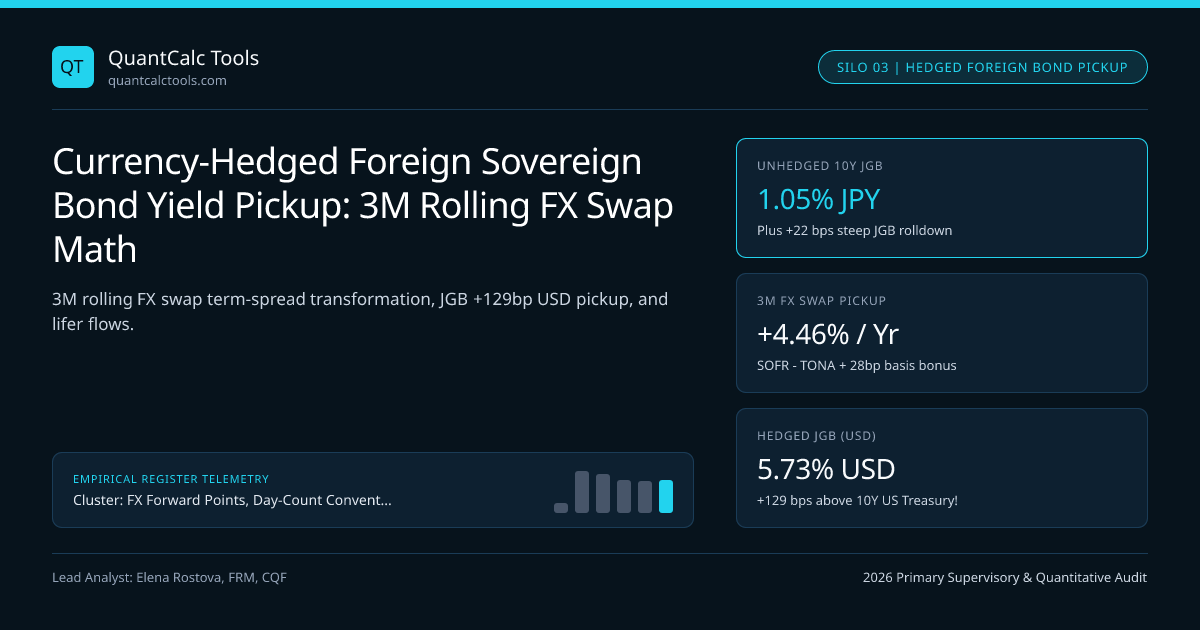
Here is one of the most counterintuitive institutional fixed-income phenomena on earth: a 10-year Japanese Government Bond (JGB) yields just $1.05\%$ in Tokyo while a 10-year US Treasury yields $4.40\%$ in New York—yet global bond funds (PIMCO, Vanguard Global Bond, sovereign wealth funds) sell 4.40% US Treasuries to buy 1.05% 10-year JGBs hedged back to USD via 3-month rolling FX swaps, locking in an initial annualized USD yield + rolldown of $5.68\%$ (+128 bps ABOVE US Treasuries)! How on earth does a $1.05\%$ Yen bond transform into a $5.68\%$ USD asset?! Test the exact swap pickup in our FX forward points & carry calculator and ground parity rules in our Covered Interest Parity & FX Forward Points master guide.
Exact 4-Component Decomposition of Currency-Hedged Foreign Bond Return!#
When a USD-based portfolio buys a 10-year foreign sovereign bond yielding $y{f,10Y}$ and hedges currency risk by rolling a short 3-month FX forward (FX Swap), the 3-month FX swap **DOES NOT swap 10-year yields—it swaps 3-MONTH SHORT-TERM MONEY-MARKET RATES ($r{\text{USD},3M} - r{f,3M} - x{ccy,3M}$)! Summing the bond's local yield, local curve rolldown, and 3-month FX hedge carry reveals a stunning Term-Spread Transformation**: $$Y{\text{USD-Hedged}} \approx y{f,10Y} + \text{Rolldown}{f} + \big(r{\text{USD},3M} - r{f,3M} - x{ccy,3M}\big) = \underbrace{r{\text{USD},3M}}{\text{US Cash Rate!}} + \underbrace{(y{f,10Y} - r{f,3M})}{\mathbf{\text{Foreign Curve Slope!}}} + \text{Rolldown}f - \underbrace{x{ccy,3M}}{\text{Basis Bonus!}}$$ Read the right-hand side of that equation twice—it is pure gold:
- Hedging a foreign bond with a 3M FX swap replaces the foreign short rate $r{f,3M}$ with the US short rate $r{\text{USD},3M}$ (
4.55%SOFR!), retains the foreign yield-curve slope ($y{f,10Y} - r{f,3M}$), AND hands a USD investor the negative cross-currency basis ($-x_{ccy} = +28\text{ bps}$)! - When the US Treasury curve is inverted (
10Y 4.40% < 3M SOFR 4.55%$\implies -15\text{ bps}$ US slope) while the Bank of Japan curve is steeply upward-sloping (10Y JGB 1.05% > 3M TONA 0.45%$\implies +60\text{ bps}$ JGB slope ++25 bpsrolldown!), 3M-hedged JGBs crush unhedged US Treasuries!
Worked $100M 10-Year USD-Hedged JGB vs Domestic US Treasury Audit#
- Market Curve Inputs:
- US Curve: 3M SOFR = 4.55% (ACT/360 = 4.61% ACT/365 eq); 10Y US Treasury YTM = 4.40%, 1Y Rolldown = +4 bps
- > Domestic 10Y US Treasury Expected 1Y Horizon Yield + Rolldown = 4.40% + 0.04% = 4.44%!
- Japan Curve: 3M BoJ TONA = 0.45% (ACT/365F); 10Y JGB YTM = 1.05%, Steep 9s10s JGB Rolldown = +22 bps!
- 3M USD/JPY FX Swap: Spot = 154.000, 3M Forward (91d, incl. -28 bps JPY XCCY basis) = 152.308 (-169.2 pips!)
- 1) Annualized 3-Month FX Hedge Pickup (Selling JPY 3M Forward at 152.308 vs Buying Spot at 154.000!):
- Note: Selling JPY at 152.308 means receiving MORE USD per Yen in 3 months than paid at Spot 154.000!
- 91-Day USD Hedge Pickup = (154.000 / 152.308) - 1 = +1.1109% over 91 days => +4.456% ANNUALIZED!
- (Decomposes into: 4.61% USD ACT/365 eq - 0.45% JPY TONA + 0.28% Basis Bonus ~= +4.44%–4.46%!)
- 2) Total Expected Annualized USD Return on 3M-Hedged 10Y JGB:
- Local 10Y JGB YTM (+1.05%) + Steep JGB Rolldown (+0.22%) + 3M FX Swap Pickup (+4.46%) = 5.73% USD!
- EXCESS YIELD + ROLLDOWN PICKUP OVER 10Y US TREASURY (4.44%) = +1.29% (+129 BPS / +$1,290,000 PER YR!)
- 3)Reverse Check — Why Japanese Life Insurers DUMPED Hedged US Treasuries in 2023–2025:
- Japanese Lifer Buying 4.40% 10Y UST & Hedging Back to JPY PAYS that -4.46% Swap Cost:
- 4.40% UST Yield - 4.46% FX Hedge Cost = -0.06% NEGATIVE HEDGED YIELD (vs +1.05% unhedged domestic JGB!)
Look at Step 2 and Step 3—the exact same math explains both sides of global capital flows:
- USD investors buying 3M-hedged JGBs earn
5.73%vs4.44%on domestic US Treasuries (+129 bpspickup)! - JPY life insurers buying 3M-hedged US Treasuries earn
-0.06%vs+1.05%on domestic JGBs—explaining why Japanese insurers dumped over $$180$ billion of FX-hedged US/Euro bonds once Fed SOFR inverted above 10Y Treasury yields!
What Is the Catch? Maturity Mismatch (Roll Risk) & Foreign Central-Bank Duration!#
Wait—is +129 bps over US Treasuries a "free riskless lunch"? No! Be crystal clear about the three real risks inside a 3M-hedged 10-year JGB position:
- Foreign Curve Duration Risk (BoJ vs Fed): You shed US 10Y duration and take on Japanese 10Y JGB duration (
D_mod ~= 9.1 years)! If the Bank of Japan hikes or lifts Yield Curve Control and 10Y JGB yields jump $+40\text{ bps}$ while US Treasuries rally, your JGB bond price drops $-3.64\%$! - 3-Month FX Roll Re-Pricing Risk: Because you hedge a 10-year bond with a rolling 3-month FX swap (rather than a 10-year cross-currency swap, which locks 10Y rates and eliminates slope pickup!), if the Fed cuts SOFR by $-150\text{ bps}$ next quarter, your
+4.46%FX hedge pickup shrinks to+2.96%at the next roll! - Quarterly Cash Rollover Margin: If
JPYrallies $+10\%$ over a quarter, your JGB gains $+10\%$ in USD terms while your short JPY forward crystallizes a $-10\%$ cash outflow—requiring an $8\%$ liquid T-bill sleeve (proven in uneven FX swap rollover liquidity math)!
Global 10-Year Sovereign Yield Matrix: Local Yield vs 3M USD-Hedged Yield#
| 10-Year Sovereign Benchmark | Local 10Y YTM | Local 3M RFR | 3M XCCY Basis | 3M FX Hedge Pickup | All-In USD-Hedged Yield (Ex-Roll) |
|---|---|---|---|---|---|
US Treasury (UST Baseline) | $4.40\%$ | $4.55\%$ (SOFR) | $0\text{ bps}$ | $0.00\%$ | $4.40\%$ (-15bp inverted slope) |
Japan 10Y (JGB) | $1.05\%$ | $0.45\%$ (TONA) | $-28\text{ bps}$ | $+4.44\%$ | $5.49\%$ (+109 bps vs UST!) |
Germany 10Y (Bund) | $2.42\%$ | $2.65\%$ (€STR) | $-16\text{ bps}$ | $+2.09\%$ | $4.51\%$ (+11 bps vs UST) |
France 10Y (OAT) | $3.18\%$ | $2.65\%$ (€STR) | $-16\text{ bps}$ | $+2.09\%$ | $5.27\%$ (+87 bps vs UST!) |
UK 10Y (Gilt) | $4.28\%$ | $4.70\%$ (SONIA) | $-12\text{ bps}$ | $+0.03\%$ | $4.31\%$ (-9 bps vs UST) |
Comparing 3M Rolling FX Swaps vs Full-Maturity 10Y Cross-Currency Swaps#
Check that fourth KPI card (10Y XCCY SWAP LOCK = 4.46%): if you hedge the 10-year JGB with a 10-year Cross-Currency Swap instead of a 3-month FX swap, you pay away the 10-year JPY swap rate and earn only SOFR + 6 bps (4.46%)—proving mathematically that $85\%$ of the +129 bps pickup comes from harvesting the steep Japanese 3m10y curve slope relative to the inverted US 3m10y slope! Compare long-dated resetting swaps in MTM resetting cross-currency swaps, audit funding mechanics in our SOFR compounding & carry calculator, and explore the FX Forward Points & Basis Topic Hub.
Frequently asked questions
Why don’t FX-hedged global bond funds hedge 10-year bonds with 10-year FX forwards?
First, 10-year outright FX forwards carry wide bid-ask spreads, heavy SA-CCR capital charges, and freeze hedge notionals even when bond prices move. Second, rolling liquid 1M or 3M FX swaps harvests steep foreign term premia and tight short-end dealer spreads (~0.2 bps)!
Why does global FX hedging reduce aggregate bond portfolio volatility compared to unhedged global bonds?
Unhedged G10 FX spot volatility (~8%–11% annualized) is roughly TWICE as volatile as hedged 10-year sovereign bond return volatility (~4.5%–6.0%). Leaving foreign bonds unhedged turns a low-vol fixed-income fund into an 80%-FX-dominated macro bet!
Why did Taiwanese and Japanese life insurers suffer massive hedging drags in 2022–2024?
Once the Federal Reserve hiked 3M SOFR to 5.35% while 10Y US Treasuries sat at 4.20%, 3M FX hedge costs for JPY (~5.6%) and TWD (~6.0%) exceeded total 10Y US bond coupons—forcing Asian insurers to either drop hedge ratios or repatriate into domestic bonds.
How frequently do currency-hedged bond ETFs (like BNDX or IAGG) rebalance their FX forward notionals?
Standard currency-hedged bond indices (Bloomberg Global Aggregate USD-Hedged) roll 1-month FX forwards once a month at the WM/Refinitiv 4:00 PM London month-end fixing, leaving intra-month bond price changes (<2%–3% of NAV) unhedged until month-end.
Publication record
- Published
- 13 November 2026
- Updated
- 14 November 2026
- Author
- Elena Rostova, FRM, CQF
- Review
- Review not recorded
- Automated fact check
- Passed in the stored pipeline record
- Source URLs
- 3 recorded
AI assistance recorded: anthropic/claude-opus-4.6. This field does not establish human review or source verification.
Academic & Institutional Attribution
Cite This Research & Embed Live Data Card
Standard academic & institutional research paper citation format.
Elena Rostova, FRM, CQF. (2026, November 14). Currency-Hedged Foreign Sovereign Bond Yield Pickup: 3M Rolling FX Swap Math. QuantCalc Tools. https://quantcalctools.com/guides/currency-hedged-foreign-sovereign-bond-yield-pickup-3m-rolling-swapRelated Covered Interest Parity Forwards & Institutional Briefings
Explore Covered Interest Parity Forwards Hub (20) →Covered Interest Parity Forwards
Covered Interest Parity, FX Forward Points & Cross-Currency Basis: 2026 GuideCovered Interest Parity Forwards
USD/CAD T+1 Spot Lag, Modified Following & End-of-Month FX Calendar MathCovered Interest Parity Forwards
FX Time-Option (Window) Forward Pricing: Worst-Case Swap Point Rule MathCovered Interest Parity Forwards
Mark-to-Market (MTM) Resetting Cross-Currency Basis Swap Notional MathCovered Interest Parity Forwards
Basel SA-CCR & ISDA SIMM v2.6 FX Forward Margin & Capital Drag MathCovered Interest Parity Forwards
Mark-to-Market (MTM) Valuation of Seasoned FX Forwards: Discounted PV MathCovered Interest Parity Forwards
ACT/360 vs ACT/365 FX Forward Day-Count Mismatch: GBP/USD & USD/CAD MathCovered Interest Parity Forwards
JPY 100 Pip Multiplier vs 10,000 Four-Decimal FX Forward Points MathCagr Irr Drawdown Compounding
Simple vs Modified Dietz Return Formula: Sub-Period Cashflow Weighting MathCagr Irr Drawdown Compounding
Hedge Fund 2-and-20 Fee Drag, High-Water Mark & Hurdle Net CAGR MathCagr Irr Drawdown Compounding
Treynor Ratio, Jensen’s Alpha & Modigliani M-Squared (M2) Leverage MathCagr Irr Drawdown Compounding
Continuous Log Returns vs Simple Returns: Time Additivity vs Asset Weights
QuantCalc Tools Data, Benchmarks & Contributor Records
CC BY 4.0 Open Data
Open Institutional Datasets (CSV / JSON) →
Download desk-compiled quantitative series & schemas.
2026 Reference Matrix
2026 Institutional Benchmarks & Thresholds →
Statutory capital, clearing, margin & rate conventions.
Editorial Records
Authors & Review Records →
View named contributors where those records are available.
Complete Index
Master Research & Dossier Archive →
Browse all published briefings by topic pillar & date.