
Parametric Var Expected Shortfall
Basel FRTB Non-Modellable Risk Factors (NMRF): RFET & SES Capital Math
Risk factors failing Basel MAR31.12 real-price observation thresholds (24 per year or 100 without 90-day gaps) are stripped from diversified Expected Shortfall and charged zero-correlation stress capital.
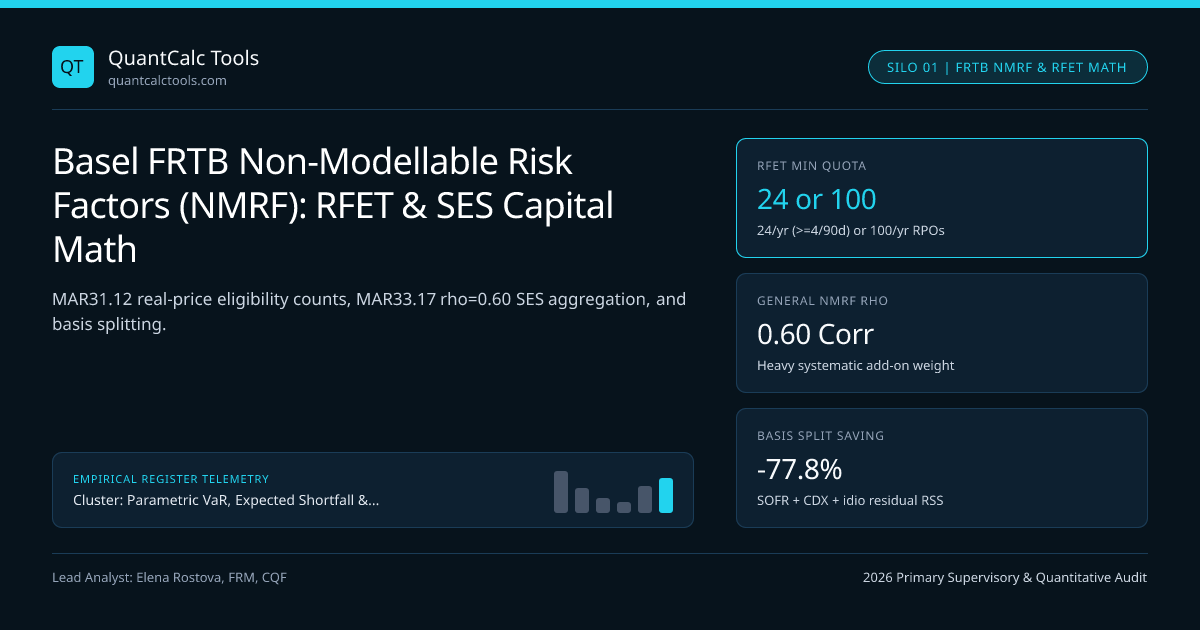
Before a trading desk can include any yield-curve tenor, volatility smile bucket, or single-name credit spread inside its diversified Basel III FRTB 97.5% Expected Shortfall engine, every mapped risk factor must pass the Risk Factor Eligibility Test (RFET) under BIS Basel Committee MAR31.12–MAR31.26! Any factor lacking sufficient verified executed trades or committed dealer quotes becomes a Non-Modellable Risk Factor (NMRF)—ejected from $IMCC$ and hit with a punitive Stress Scenario Risk Measure ($SES$) under MAR33.16–MAR33.17 that bans virtually all diversification! Compare standard modellable tail quantiles in our Value at Risk (VaR) calculator and trace total IMA capital inside our Parametric VaR & Expected Shortfall calibration guide.
Two-Path Risk Factor Eligibility Test (RFET) Real-Price Counting Rules#
What counts as a Real Price Observation (RPO) under MAR31.12? Only (1) an actual trade executed by the bank, (2) a verifiable third-party transaction price (such as TRACE, swap execution facility tapes, or pooled data-vendor consortia), or (3) a firm committed quote where a counterparty is legally bound to transact—never indicative broker screens or internal model interpolations! Over a rolling 12-month window, a risk factor bucket passes RFET if it satisfies either Path A or Path B (plus data-quality principles):
- Path A (Standard Liquidity): At least 24 real price observations in the 12-month window (at most 1 counted per day) AND zero 90-day rolling sub-windows containing fewer than 4 real price observations! (Notice how a seasonal bond trading 30 times in Q1 and 2 times in Q3 FAILS Path A due to the 90-day drought rule!)
- Path B (Seasonal / Concentrated Liquidity): At least 100 real price observations in the preceding 12 months (removing the 90-day gap test).
Worked MAR31 RFET Real-Price Audit & SES Quadratic Capital Aggregation#
- NMRF Inventory (Failed MAR31.12 RFET):
- 1) Idiosyncratic Credit Spread NMRFs (L = 4 off-the-run single-name CDS basis curves, rho = 0 allowed!):
- SES_credit = { $1,800,000 , $1,450,000 , $1,100,000 , $950,000 } (Liquidity horizon = max(60d, 20d) = 60d)
- 2) Idiosyncratic Equity Vol NMRFs (K = 2 illiquid long-dated 5Y skew buckets, rho = 0 allowed!):
- SESeqiso = { $1,250,000 , $850,000 }
- 3) Non-Idiosyncratic / Systematic Curve NMRFs (M = 3 exotic EM inflation & cross-currency basis tenors, rho = 0.60!):
- SES_other = { $2,200,000 , $1,600,000 , $1,300,000 } (Sum = $5,100,000; Sum of Squares = $9,090,000^2? No: 4.84+2.56+1.69 = 9.09 M^2)
- Exact MAR33.17 Total SES Aggregation Formula (rho = 0.60 -> rho^2 = 0.36, 1 - rho^2 = 0.64):
- SEStotal = sqrt( Sum{i=1}^I SES_{credit,i}^2 )
- + sqrt( Sum{j=1}^J SES{eq_iso,j}^2 )
- + sqrt( (rho * Sum{k=1}^K SES{other,k})^2 + (1 - rho^2) * Sum{k=1}^K SES{other,k}^2 )
- Step-by-Step Numerical Evaluation:
- 1) Idiosyncratic Credit Root-Sum-Squares:
- sqrt( 1.80^2 + 1.45^2 + 1.10^2 + 0.95^2 ) = sqrt( 3.24 + 2.1025 + 1.21 + 0.9025 ) = sqrt(7.4550) = $2,730,385
- 2) Idiosyncratic Equity Root-Sum-Squares:
- sqrt( 1.25^2 + 0.85^2 ) = sqrt( 1.5625 + 0.7225 ) = sqrt(2.2850) = $1,511,622
- 3) Systematic / General NMRFs (rho = 0.60 Penalty!):
- Linear Sum = $2.20M + $1.60M + $1.30M = $5.10M => (0.60 * 5.10M)^2 = 9.3636 ($M^2)
- Squared Sum = 2.20^2 + 1.60^2 + 1.30^2 = 9.09 => 0.64 * 9.09M^2 = 5.8176 ($M^2)
- Systematic Block = sqrt( 9.3636 + 5.8176 ) = sqrt(15.1812) = $3,896,306
- Total Unmultiplied NMRF Capital Add-On (SES) = $2,730,385 + $1,511,622 + $3,896,306 = $8,138,313!
Notice three crucial structural facts in MAR33.16–MAR33.17:
- Liquidity Horizon Floor of 20 Days: Every NMRF stress scenario must be calibrated over a liquidity horizon of $\max(LH_{\text{statutory}},\; 20\text{ days})$—even a 10-day FX or sovereign rate bucket jumps automatically to at least 20 days ($+41.4\%$ volatility scaling) the instant it fails RFET!
- Zero Hedging Across NMRFs: If a desk is long Off-the-Run Bond A (NMRF) and short Off-the-Run Bond B (NMRF), squaring $SES_i^2$ erases signs—two offsetting NMRFs ADD risk instead of netting, unless decomposed cleanly into a modellable systematic curve factor plus tiny idiosyncratic basis residuals!
- No $1.50\times$ Multiplier on $SES$: In total IMA capital $CA = \max(IMCC{t-1} + SES{t-1},\; mc \cdot IMCC{avg} + SES{avg})$, the backtesting multiplier $mc \ge 1.50$ multiplies $IMCC{avg}$ only, not $SES_{avg}$!
Regulatory Bucketing Strategy: Standard vs Bank-Own Buckets (MAR31.16)#
For curves and volatility surfaces (e.g., an equity implied volatility surface spanning strikes and expiries), RFET is tested per regulatory bucket, not per infinitesimal strike point! Under the FRTB-ES-975 2026 Standard enforced by UK PRA and EU CRR3 supervisors, a single real option trade falling anywhere inside a regulatory delta-maturity bucket counts toward that entire bucket's 24-observation quota:
FRTB Modellable vs Non-Modellable Risk Factor Capital Charge Comparison#
| Risk Factor Type | RFET Bucketing Architecture (MAR31.16) | NMRF Aggregation Class | Correlation Parameter ($\rho$) | Capital Optimization Technique |
|---|---|---|---|---|
| G10 Yield Curve Tenors | 9 standard maturity buckets (0-0.25Y .. 30Y+) | General Curve NMRF | $\rho = 0.60$ | Map cashflows to adjacent liquid swap pillars |
| Single-Name Corporate CDS | Per-issuer tenor buckets (0-1.5Y .. 7.5Y+) | Idiosyncratic Credit Spread | $\rho = 0.00$ (RSS) | Decompose into CDX IG/HY index + issuer residual! |
| Equity Implied Vol Surface | Moneyness $\times$ Expiry grid buckets | General Vol Surface NMRF | $\rho = 0.60$ | Pool RPOs via industry data utility consortia |
| Bespoke Equity Dividend Futures | Annual dividend strip buckets | Idiosyncratic Equity | $\rho = 0.00$ (RSS) | Separate index forward carry from tail years |
| Exotic Cross-Currency Basis | Pair $\times$ Maturity bucket | General FX Basis NMRF | $\rho = 0.60$ | Compare against ISDA SIMM v2.6 SA fallback |
The Golden Rule of FRTB Engineering: Isolate the Idiosyncratic Residual!#
Study that second chart carefully: if an off-the-run 7-year BBB corporate bond trades only 11 times a year (failing RFET), modeling its all-in yield as a single factor forces 100% of its interest-rate duration and credit-market beta into NMRF at $\rho = 0.60$ ($\$9.80\text{M}$ charge)! Instead, parameterize the bond's yield as $y{bond} = y{\text{SOFR}, 7Y} + s{\text{CDX.IG}, 7Y} + \epsilon{\text{issuer}}$: both $y{\text{SOFR}}$ and $s{\text{CDX.IG}}$ easily pass RFET with 250 daily RPOs and enter diversified Stressed Expected Shortfall ($IMCC$), leaving only the tiny issuer-specific basis $\epsilon_{\text{issuer}}$ in NMRF—where it further qualifies for $\rho = 0.00$ idiosyncratic root-sum-of-squares ($\$2.18\text{M}$ total capital, a 77.8% capital reduction) alongside the 20-to-120-day rules in Basel FRTB liquidity horizon bucketing! Explore all 20 guides on the Parametric VaR & Expected Shortfall Topic Hub.
Frequently asked questions
Why can a risk factor with 45 real trades in a year still fail the Basel RFET test?
Under MAR31.12 Path A, having >=24 real price observations is necessary but not sufficient: the bucket must also record at least 4 real price observations in EVERY rolling 90-day sub-period! Unless annual trades reach >=100 (Path B), a quiet summer quarter triggers NMRF status.
Do two offsetting long and short positions in different NMRFs hedge each other in SES capital?
No! Each NMRF’s stress loss SES_k is positive and squared or summed inside MAR33.17. Holding long Issuer A NMRF and short Issuer B NMRF increases total SES capital unless their shared sector beta is extracted into a modellable index factor.
Does the 1.50x Basel backtesting multiplier apply to Non-Modellable Risk Factor (SES) capital?
No. Under MAR33.43, the regulatory multiplier m_c (1.50x to 2.00x) multiplies 60-day average modellable IMCC only; 60-day average SES is added unmultiplied on top (plus the Default Risk Charge DRC).
What happens if stripping NMRFs causes a trading desk to fail the P&L Attribution Test (PLAT)?
For MAR32 P&L Attribution testing, banks are permitted to include risk factors in Risk-Theoretical P&L (RTPL) if real prices exist to value them, or align valuation inputs—if PLAT still lands in the Red Zone, the entire desk reverts to the Standardized Approach.
Publication record
- Published
- 14 November 2026
- Updated
- 14 November 2026
- Author
- Elena Rostova, FRM, CQF
- Review
- Review not recorded
- Automated fact check
- Passed in the stored pipeline record
- Source URLs
- 3 recorded
AI assistance recorded: anthropic/claude-opus-4.6. This field does not establish human review or source verification.
Academic & Institutional Attribution
Cite This Research & Embed Live Data Card
Standard academic & institutional research paper citation format.
Elena Rostova, FRM, CQF. (2026, November 14). Basel FRTB Non-Modellable Risk Factors (NMRF): RFET & SES Capital Math. QuantCalc Tools. https://quantcalctools.com/guides/basel-non-modellable-risk-factors-nmrf-stress-scenario-add-onsRelated Parametric Var Expected Shortfall & Institutional Briefings
Explore Parametric Var Expected Shortfall Hub (20) →Parametric Var Expected Shortfall
Parametric VaR, Expected Shortfall & Fat-Tail Risk Calibration: 2026 Quantitative GuideParametric Var Expected Shortfall
Cornish-Fisher VaR Quantile Expansion: Skewness & Excess Kurtosis Formula GuideParametric Var Expected Shortfall
Student-t Expected Shortfall Formula: Degrees-of-Freedom & Unit-Variance ScalingParametric Var Expected Shortfall
Basel III FRTB 97.5% Expected Shortfall: MAR33 Liquidity Horizon Scaling MathParametric Var Expected Shortfall
EWMA Lambda 0.94 vs GARCH(1,1) Volatility Decay: Conditional VaR Math GuideParametric Var Expected Shortfall
Kupiec POF Likelihood Ratio Test: VaR Backtesting & Basel Traffic-Light ZonesParametric Var Expected Shortfall
Christoffersen Markov Independence Test: VaR Clustering & Conditional CoverageParametric Var Expected Shortfall
Square-Root-of-Time VaR Scaling Bias: AR(1) Serial Correlation Math GuideCovered Interest Parity Forwards
ACT/360 vs ACT/365 FX Forward Day-Count Mismatch: GBP/USD & USD/CAD MathCovered Interest Parity Forwards
JPY 100 Pip Multiplier vs 10,000 Four-Decimal FX Forward Points MathCovered Interest Parity Forwards
Cross-Currency Basis Swap Deviation: Covered Interest Parity Wedge MathCovered Interest Parity Forwards
Overnight (O/N), Tom-Next (T/N) & Spot-Next (S/N) T+2 FX Roll Math
QuantCalc Tools Data, Benchmarks & Contributor Records
CC BY 4.0 Open Data
Open Institutional Datasets (CSV / JSON) →
Download desk-compiled quantitative series & schemas.
2026 Reference Matrix
2026 Institutional Benchmarks & Thresholds →
Statutory capital, clearing, margin & rate conventions.
Editorial Records
Authors & Review Records →
View named contributors where those records are available.
Complete Index
Master Research & Dossier Archive →
Browse all published briefings by topic pillar & date.