
Parametric Var Expected Shortfall
Christoffersen Markov Independence Test: VaR Clustering & Conditional Coverage
Christoffersen’s conditional coverage backtest decomposes VaR validation into Kupiec unconditional frequency plus a 1-df Markov transition test that catches consecutive breach streaks.
Four Value-at-Risk exceptions spaced evenly across March, June, September, and December signal healthy 99% quantile calibration; four consecutive VaR exceptions inside a single October liquidity rout threaten clearinghouse default before margin calls can settle. Because Kupiec POF backtesting inspects only total breach counts, Christoffersen (1998) formulated a first-order Markov chain independence test ($LR_{ind}$) and combined it additively into a Conditional Coverage test ($LR{cc} = LR{pof} + LR_{ind} \sim \chi^2(2)$). Calibrate responsive volatility inputs in our Value at Risk (VaR) calculator and anchor your backtesting workflow in our Parametric VaR & Expected Shortfall calibration guide.
Binary Transition Contingency Matrix and Markov Log-Likelihood Math#
Define the hit sequence $It \in \{0, 1\}$ for $t = 1, \dots, N$, where $It = 1$ denotes a VaR breach ($\text{PnL}t < -VaRt$). Count the $N - 1$ adjacent day-to-day transitions $n{ij} = \sum{t=2}^N \mathbb{I}{\{I{t-1}=i,\; I_t=j\}}$ across four contingency cells:
- $n_{00}$: Quiet day followed by quiet day
- $n_{01}$: Quiet day followed by VaR breach
- $n_{10}$: VaR breach followed by quiet day
- $n_{11}$: Back-to-back VaR breach streak!
Define empirical conditional breach probabilities $\hat{\pi}{01} = \frac{n{01}}{n{00} + n{01}}$ (breach rate after a non-breach) and $\hat{\pi}{11} = \frac{n{11}}{n{10} + n{11}}$ (breach rate immediately after a breach), alongside pooled unconditional transition probability $\hat{\pi} = \frac{n{01} + n{11}}{N - 1}$. Under serial independence ($H0: \pi{01} = \pi_{11} = \pi$), yesterday's hit provides zero predictive edge for today's hit:
Worked Clustered-Breach Markov Contingency & LR_cc Calculation#
- Scenario: Total Breaches x = 4 (Passes Kupiec Green Zone!), with 2 Back-to-Back Clustering Pairs!
- Transition Counts (N - 1 = 249 transitions, starting at I_1 = 0):
- n00 = 243, n01 = 2 => pi_01 = 2 / 245 = 0.008163 (0.82% hit rate after calm day)
- n10 = 2, n11 = 2 => pi_11 = 2 / 4 = 0.500000 (50.00% hit rate after breach!)
- Pooled pi = (2 + 2) / 249 = 4 / 249 = 0.016064
- 1) Log-Likelihood Under Null Independence (L_0):
- ln(L0) = (n00 + n10)*ln(1 - pi) + (n01 + n_11)*ln(pi)
- = 245 * ln(0.983936) + 4 * ln(0.016064) = -3.96754 - 16.52472 = -20.49226
- 2) Log-Likelihood Under Markov Clustering Alternative (L_1):
- ln(L1) = n00ln(1 - pi01) + n01ln(pi01) + n10ln(1 - pi11) + n11ln(pi_11)
- = 243ln(0.991837) + 2ln(0.008163) + 2ln(0.50) + 2ln(0.50)
- = -1.99173 - 9.61630 - 1.38629 - 1.38629 = -14.38061
- 3) Test Statistics & Chi-Squared Critical Comparisons:
- LRind = -2 * (-20.49226 - (-14.38061)) = 12.2233 >> 3.8415 (chi^21 at 95%, p = 0.00047!)
- LR_pof = 0.7691 (from x = 4 Kupiec test)
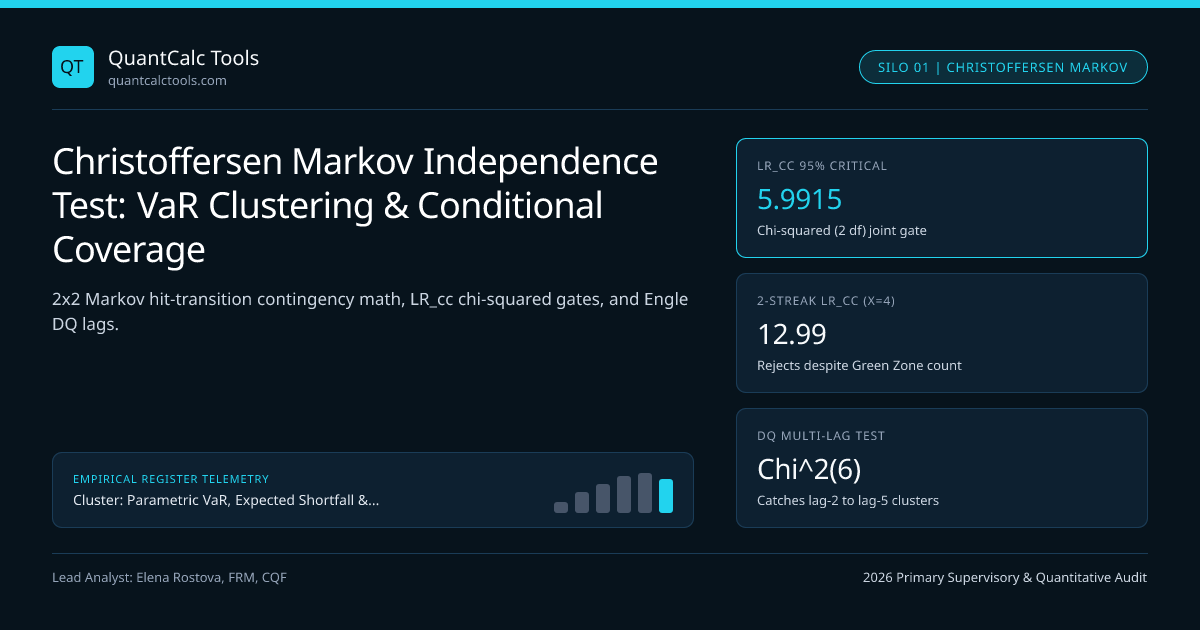
- LRcc = LRpof + LRind = 0.7691 + 12.2233 = 12.9924 >> 5.9915 (chi^22 at 95%, REJECT!)
That numerical proof is why every institutional model-risk validator runs Christoffersen alongside Kupiec: a static 250-day historical VaR model with only 4 breaches sails through Basel's Green Zone on frequency ($LR{pof} = 0.77$), yet fails conditional coverage decisively ($LR{cc} = 12.99 > 5.99, p = 0.0015$) because two consecutive breach pairs expose unmodeled volatility clustering! Upgrading the volatility filter to EWMA lambda 0.94 or GARCH(1,1) lifts conditional $\sigmat$ immediately after the first breach, suppressing $n{11}$ back toward zero.
Handling Zero-Streak Singularity ($n_{11} = 0$) and Multi-Day Lag Blind Spots#
Two implementation subtleties arise when coding Christoffersen in Python or TypeScript:
- Zero Back-to-Back Breaches ($n_{11} = 0$): When $n{11} = 0$, $\hat{\pi}{11} = 0$, so the term $n{11}\ln(\hat{\pi}{11})$ must be evaluated via $0 \cdot \ln(0) \equiv 0$. Interestingly, when $n{11} = 0$ and $x = 4$, $LR{ind}$ is tiny ($0.1306$), confirming independence. Conversely, even a single consecutive breach pair ($n{11} = 1$ out of $x = 4$ hits) drives $\hat{\pi}{11} = 1/4 = 25\%$ vs $\hat{\pi}{01} = 3/245 = 1.22\%$, producing $LR{ind} = 4.62 > 3.8415$!
- Every-Other-Day Clustering ($I = [1, 0, 1, 0, 1]$): First-order Markov chains inspect only lag-1 transitions! If a nervous trader cuts half a position after Monday's VaR breach, survives Tuesday, and breaches again on Wednesday and Friday, $n{11} = 0$ completely fools first-order $LR{ind}$! Christoffersen & Pelletier (2004) closed this loophole with the Duration-Based VaR Backtest, modeling the number of days $D_i$ between breaches via a Weibull hazard distribution where memoryless independence requires shape parameter $b = 1.0$ ($b < 1$ proves multi-lag clustering).
Comparing VaR Exception Independence & Dynamic Quantile Backtests#
| Backtest Specification | Null Hypothesis Tested | Degrees of Freedom | 95% Critical Value | Primary Blind Spot |
|---|---|---|---|---|
| Kupiec POF ($LR_{pof}$) | $\mathbb{E}[I_t] = 1 - \alpha$ | $\chi^2(1)$ | $3.8415$ | Ignores streak clustering completely |
| Christoffersen Independence ($LR_{ind}$) | $\pi{01} = \pi{11}$ (Lag-1 Markov) | $\chi^2(1)$ | $3.8415$ | Ignores wrong overall hit rate & lag $\ge 2$ |
| Conditional Coverage ($LR_{cc}$) | $\pi{01} = \pi{11} = 1 - \alpha$ | $\chi^2(2)$ | $5.9915$ | Misses lag-2/lag-3 alternating clusters |
| Christoffersen-Pelletier Weibull | Hazard memory $b = 1$ | $\chi^2(1)$ (Bootstrapped) | $\approx 3.84$ (Monte Carlo p-val) | Requires $\ge 8$ hits for Weibull MLE fit |
| Dynamic Quantile (Engle-Manganelli) | Hit orthogonality to lagged VaR & PnL | $\chi^2(q)$ | $12.5916$ ($q=6$ regressors) | Sensitive to regressor specification |
(Note a subtle algebraic precision detail in LR_cc = LR_pof + LR_ind: exact equality holds when the initial observation $I1$ is conditioned out so both $LR{pof}$ and $LR{ind}$ are evaluated over the identical $N - 1$ transition sample; if $LR{pof}$ uses all $N$ days, the sum differs by at most $\mathcal{O}(1/N)$ depending on whether $I_1 = 1$.)
Upgrading to Engle-Manganelli Dynamic Quantile (DQ) Regression#
To test lag-1 through lag-5 breach autocorrelation and check whether breaches correlate with elevated lagged VaR levels simultaneously, risk teams run Engle and Manganelli's (2004) linear Dynamic Quantile test: define demeaned hits $\text{Hit}t = It - (1 - \alpha)$ and test $H0: \beta = 0$ in $\text{Hit}t = Xt\beta + ut$ where $Xt = [1, \text{Hit}{t-1}, \dots, \text{Hit}{t-4}, VaRt]$, yielding $DQ = \frac{\text{Hit}^\top X (X^\top X)^{-1} X^\top \text{Hit}}{(1-\alpha)\alpha} \sim \chi^2(6)$. Combine hit-clustering checks with tail-magnitude validation in Acerbi-Szekely Expected Shortfall Z2 backtesting, explore the Parametric VaR & Expected Shortfall Topic Hub, and verify margin model standards such as CME SPAN 2 VaR.
Frequently asked questions
How can a VaR model pass Basel Green Zone backtesting yet fail Christoffersen Conditional Coverage?
Basel Green Zone counts only total breaches (0 to 4 over 250 days). If 4 breaches occur as two consecutive back-to-back pairs during a crisis week (n11 = 2), Kupiec LR_pof is just 0.77, but Markov clustering drives LR_ind to 12.22, rejecting LR_cc = 12.99 > 5.9915.
What remedies fix a VaR engine that fails the Christoffersen independence test?
Independence failures almost always stem from slow-moving equal-weighted historical volatility windows. Switching to GJR-GARCH(1,1), Filtered Historical Simulation, or intraday Yang-Zhang volatility scales VaR upward immediately after Day 1’s shock, eliminating consecutive breaches.
Why does first-order Christoffersen LR_ind miss alternating every-other-day VaR breaches?
The 2x2 transition matrix inspects only adjacent t-1 to t pairs. An alternating breach pattern [1, 0, 1, 0, 1] produces n11 = 0 consecutive pairs, requiring Engle-Manganelli multi-lag Dynamic Quantile regression or Weibull inter-breach duration tests to detect.
Why are finite-sample Monte Carlo p-values preferred over asymptotic chi-squared tables for 99% VaR?
At 99% VaR over 250 days, expected breaches equal 2.5 and expected back-to-back hits under independence equal just 0.025, making contingency cell n11 extremely sparse; Dufour’s Monte Carlo tie-breaking p-values eliminate small-sample size distortion.
Publication record
- Published
- 14 November 2026
- Updated
- 14 November 2026
- Author
- Elena Rostova, FRM, CQF
- Review
- Review not recorded
- Automated fact check
- Passed in the stored pipeline record
- Source URLs
- 3 recorded
AI assistance recorded: anthropic/claude-opus-4.6. This field does not establish human review or source verification.
Academic & Institutional Attribution
Cite This Research & Embed Live Data Card
Standard academic & institutional research paper citation format.
Elena Rostova, FRM, CQF. (2026, November 14). Christoffersen Markov Independence Test: VaR Clustering & Conditional Coverage. QuantCalc Tools. https://quantcalctools.com/guides/christoffersen-markov-independence-conditional-coverage-testRelated Parametric Var Expected Shortfall & Institutional Briefings
Explore Parametric Var Expected Shortfall Hub (20) →Parametric Var Expected Shortfall
Parametric VaR, Expected Shortfall & Fat-Tail Risk Calibration: 2026 Quantitative GuideParametric Var Expected Shortfall
Square-Root-of-Time VaR Scaling Bias: AR(1) Serial Correlation Math GuideParametric Var Expected Shortfall
Marginal, Incremental & Component VaR: Euler Portfolio Risk Attribution MathParametric Var Expected Shortfall
Delta-Gamma Parametric VaR Formula: Quadratic Taylor Options Convexity MathParametric Var Expected Shortfall
Filtered Historical Simulation (FHS): GARCH Bootstrap VaR & ES Math GuideParametric Var Expected Shortfall
Extreme Value Theory (EVT) Peaks-Over-Threshold: GPD VaR & ES Formula GuideParametric Var Expected Shortfall
Cholesky Factorization in Monte Carlo VaR: Fixing Broken Correlation GridsParametric Var Expected Shortfall
FRTB Stressed Expected Shortfall: Reduced-Factor MAR33.5 Calibration MathBond Duration Convexity Math
DV01 & PVBP Formula: Why Dirty Invoice Price Scales Dollar DurationBond Duration Convexity Math
Second-Order Bond Convexity Formula: Taylor Error Under Large Yield ShocksBond Duration Convexity Math
Negative Convexity in Callable Bonds & Agency MBS: OAS Finite-Difference MathBond Duration Convexity Math
DV01-Neutral Barbell vs Bullet Portfolio: Convexity Pickup vs Yield Math
QuantCalc Tools Data, Benchmarks & Contributor Records
CC BY 4.0 Open Data
Open Institutional Datasets (CSV / JSON) →
Download desk-compiled quantitative series & schemas.
2026 Reference Matrix
2026 Institutional Benchmarks & Thresholds →
Statutory capital, clearing, margin & rate conventions.
Editorial Records
Authors & Review Records →
View named contributors where those records are available.
Complete Index
Master Research & Dossier Archive →
Browse all published briefings by topic pillar & date.