
Continuous Merton-Kelly Leverage ((mu - r_f)/sigma^2) & Half-Kelly Math
Under geometric Brownian motion, continuous log-optimal leverage equals excess arithmetic drift divided by variance; prove the exact c*(2-c) fractional Kelly parabola and Sharpe^2 growth ceiling.
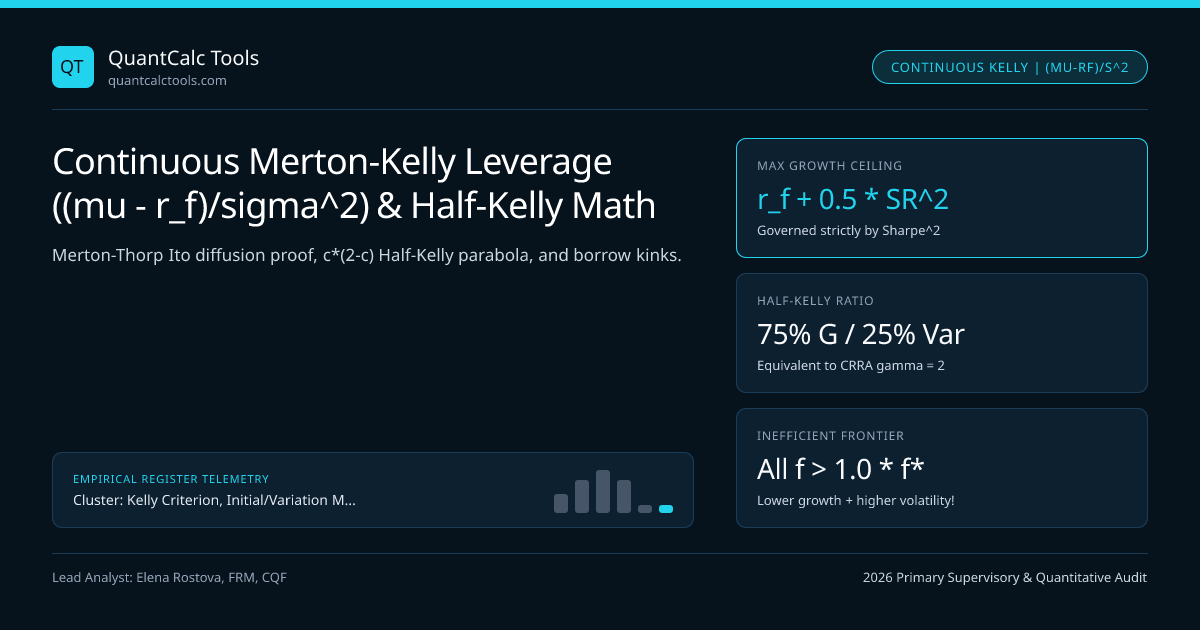
Real-world asset returns are continuous distributions rather than discrete coin tosses. In 1969–1971, Edward Thorp and Nobel laureate Robert Merton extended Kelly's logarithmic utility criterion ($U(W) = \ln W$) to continuous-time geometric Brownian motion, producing the single most important equation in institutional leverage management: *$f^ = \frac{\mu - r_f}{\sigma^2} = \frac{\text{SR}}{\sigma}$. Even better, continuous calculus reveals a quadratic miracle at Half-Kelly ($f = 0.5 f^$): cutting leverage in half sacrifices only $25\%$* of theoretical maximum excess compounding while eliminating $75\%$ of portfolio variance! Run live fractional simulations in our Kelly Criterion Calculator, inspect the Continuous Fractional Half-Kelly Engine, and anchor in our Kelly, Margin & Liquidation Hub.
Exact Ito's Lemma Derivation: Why Maximum Log Growth Equals $r_f + \frac{1}{2}\text{SR}^2$#
Let risky asset $St$ follow $dSt / St = \mu\,dt + \sigma\,dWt$ (critical warning: $\mu$ here is the ARITHMETIC instantaneous drift, NEVER historical geometric CAGR $g = \mu - \frac{1}{2}\sigma^2$!) and risk-free cash earn $rf$. Allocating constant fraction $f$ of wealth $Wt$ to the risky asset (borrowing $(f-1)Wt$ at $rf$ when $f > 1$) yields $dWt / Wt = [rf + f(\mu - rf)]\,dt + f\sigma\,dWt$. Applying Ito's Lemma to $\ln Wt$ gives exact asymptotic log-growth rate $g(f)$ as a downward-opening parabola in $f$:
- Asymptotic Log-Growth Rate : g(f) = rf + f * (mu - rf) - 0.5 * f^2 * sigma^2
- First-Order Condition g'=0 : (mu - rf) - f* * sigma^2 = 0 => f* = (mu - rf) / sigma^2 = SR / sigma
- Max Theoretical Growth Rate: g(f) = r_f + 0.5 [ (mu - rf)^2 / sigma^2 ] = rf + 0.5 * SR^2
- Exact Fractional Kelly Scaling Law (Let f = c * f*, for any multiplier c > 0):
- g(c * f) - r_f = c (2 - c) * [ 0.5 * SR^2 ]
- Portfolio Vol = c * f* * sigma = c * SR
- Portfolio Variance = c^2 * SR^2 (At Half-Kelly c = 0.5: Growth keeps 0.5*(1.5) = 75.0%; Variance drops to 0.25 = 25.0%!)
- Worked InstitutionalCTA Sizing Audit (rf = 4.50%, Sharpe SR = 0.80, Unlevered Vol sigma = 12.0% -> mu - rf = 9.60%):
- 1. Full Kelly (c = 1.0) : f* = 0.096 / 0.0144 = 6.67x Leverage! | Vol = 80.0% | g(f) = 4.50% + 0.5(0.64) = 36.50% log (CAGR = 44.0%!)
- (Wait: 80% annual vol means routine -55% drawdowns & massive CME margin calls!)
- 2. Half Kelly (c = 0.5) : 0.5f = 3.33x Leverage | Vol = 40.0% | g = 4.50% + 0.75*(32.0%) = 28.50% log (CAGR = 33.0%!)
- 3. Quarter Kelly (c=0.25): 0.25f= 1.67x Leverage | Vol = 20.0% | g = 4.50% + 0.4375*(32%) = 18.50% log (CAGR = 20.3%, institutional sweet spot!)
Look at the Maximum Growth Identity $g(f^) = r_f + \frac{1}{2}\text{SR}^2$: maximum achievable geometric compounding depends ONLY on the strategy's squared Sharpe Ratio $\text{SR}^2$, completely independent of whether the underlying asset has $5\%$ volatility or $50\%$ volatility! A low-volatility bond arbitrage pod with $\text{SR} = 1.40$ has nearly $8\times$ higher* Kelly growth capacity ($\frac{1}{2}(1.96) = +98\%$ log excess) than an equity index with $\text{SR} = 0.50$ ($\frac{1}{2}(0.25) = +12.5\%$ log excess), provided institutional financing spreads remain tight!
Exact Adjustment When Margin Borrowing Rate $rb$ Exceeds Cash Rate $rf$#
Textbook Merton-Kelly assumes you can borrow at the exact same risk-free rate $rf$ that cash earns. On a real brokerage desk (SOFR Carry Calculator), cash earns $rf = 4.50\%$ while margin loans cost $r_b = 5.75\%$ (+125 bps prime spread). That creates a three-zone kinked Kelly solution:
- If $(\mu - rf) / \sigma^2 \le 1$: You hold positive cash (no borrowing), so *$f^ = (\mu - rf) / \sigma^2$**.
- If $(\mu - rb) / \sigma^2 \ge 1$: Marginal leverage clears the higher borrow cost, so *$f^ = (\mu - rb) / \sigma^2$**!
- If $(\mu - rb) / \sigma^2 < 1 < (\mu - rf) / \sigma^2$: *Optimal leverage clamps at exact `f = 1.00x` ($100\%$ unlevered equity, zero margin loan)**!
Complete Fractional Kelly Scaling Schedule ($c \in [0.20, 2.25]$)#
Inspect the exact algebraic trade-off across fractional multiplier $c = f / f^*$ under continuous Brownian motion:
| Fractional Multiplier ($c = f / f^*$) | Excess Log Growth Kept $c(2-c)$ | Portfolio Vol ($c \cdot \text{SR}$) | Portfolio Variance ($c^2$) | Prob of $-50\%$ Drawdown | Institutional Desk Usage |
|---|---|---|---|---|---|
0.25x Quarter-Kelly | $43.75\%$ | $0.25\,\text{SR}$ | $6.25\%$ | $1.56\%$ ((0.5)^6) | Multi-strategy / pension standard |
0.50x Half-Kelly | $75.00\%$ | $0.50\,\text{SR}$ | $25.00\%$ | $12.50\%$ ((0.5)^3) | Classic Thorp / Ziemba quant ceiling |
0.75x Three-Quarter Kelly | $93.75\%$ | $0.75\,\text{SR}$ | $56.25\%$ | $31.50\%$ | Aggressive prop (high parameter confidence) |
1.00x Full-Kelly | $100.00\%$ (Peak) | $1.00\,\text{SR}$ | $100.00\%$ | $50.00\%$ ((0.5)^1) | Theoretical upper bound — too volatile live! |
1.50x Over-Kelly | $75.00\%$ (Inferior!) | $1.50\,\text{SR}$ | $225.00\%$ | $75.98\%$ | Strictly dominated by 0.50x (3x vol for same g!) |
2.00x Double-Kelly Cliff | $0.00\%$ (Wiped!) | $2.00\,\text{SR}$ | $400.00\%$ | $87.50\%$ | Zero excess growth; $>2.0\times$ decays to $0$! |
Subtle Coding Bug Alert: Plugging Historical CAGR $g$ Instead of Arithmetic $\mu$!#
Watch out for a famous formula collision! If you read a long-run equity study quoting historical geometric CAGR $g = 10.0\%$, cash $rf = 4.5\%$, and volatility $\sigma = 18.0\%$ ($\sigma^2 = 0.0324$), DO NOT plug $g = 10.0\%$ into $(g - rf)/\sigma^2$! Remember $\mu = g + \frac{1}{2}\sigma^2 = 10.0\% + 1.62\% = 11.62\%$: plugging geometric $g$ instead of arithmetic $\mu$ silently subtracts $-0.50$ from optimal leverage ((g - r_f)/sigma^2 = f* - 0.5)!
Utility Theory Connection: Fractional $c$-Kelly Equals CRRA Power Utility ($\gamma = 1/c$)#
MacLean, Thorp & Ziemba (2011) proved that trading constant fractional Kelly $f = c \cdot f^$ is 100% mathematically equivalent* to maximizing Constant Relative Risk Aversion (CRRA) power utility $U(W) = \frac{W^{1-\gamma}}{1-\gamma}$ with risk-aversion coefficient $\gamma = \frac{1}{c}$: Full Kelly is $\gamma = 1$ ($\ln W$), Half-Kelly is $\gamma = 2$, and Quarter-Kelly is $\gamma = 4$! Extend single-asset Merton-Kelly to correlated books in multi-asset inverse-covariance Kelly shrinkage and drawdown-constrained fractional Kelly, and test Sharpe inputs in our Sharpe & Sortino Calculator.
Frequently asked questions
Why does continuous Merton-Kelly allow f* > 100% (say 3.0x leverage) when discrete binary Kelly never exceeds 100%?
In discrete binary Kelly where a loss forfeits 100% of your stake, betting f >= 100% carries positive probability of instant total ruin in one step. Under continuous diffusion Brownian motion with continuous rebalancing (zero jumps!), prices move continuously without gapping, allowing f* > 1. In real markets with overnight jump risk, always cap leverage against jump ruin!
How do Poisson crash jumps (Merton Jump-Diffusion) change continuous Kelly leverage?
Even a tiny 5% annual probability of a -25% instantaneous crash jump slashes optimal Kelly leverage by 30% to 50% below the pure Brownian (mu - r_f)/sigma^2 formula, because concave log utility ln(1 - 0.25*f) imposes an infinite barrier at f = 1 / 0.25 = 4.0x regardless of how high normal-times Sharpe looks!
How does estimation uncertainty in sample mean return (Baker & McHale 2013) shrink optimal Kelly?
Because true drift mu is estimated from T years of noisy data with standard error sigma / sqrt(T), integrating over the Bayesian predictive Student-t distribution multiplies plug-in Kelly f* by a shrinkage factor approximately equal to 1 / (1 + 1 / [SR^2 * T] ...)—typically recommending 0.3x to 0.6x plug-in Kelly on 5-year track records.
Why is 1.5x Over-Kelly strictly irrational for every risk-averse investor?
Look at the parabola c*(2 - c): c = 1.50 and c = 0.50 BOTH yield 0.75 * max_growth (exact same compounding rate!), yet c = 1.50 suffers THREE TIMES the volatility and a 76% probability of a -50% drawdown versus 12.5% at Half-Kelly. Every point c > 1.0 lies on the inefficient side of the growth-variance frontier!
Publication record
- Published
- 13 November 2026
- Updated
- 14 November 2026
- Author
- Elena Rostova, FRM, CQF
- Review
- Review not recorded
- Automated fact check
- Passed in the stored pipeline record
- Source URLs
- 4 recorded
AI assistance recorded: anthropic/claude-opus-4.6. This field does not establish human review or source verification.
Academic & Institutional Attribution
Cite This Research & Embed Live Data Card
Standard academic & institutional research paper citation format.
Elena Rostova, FRM, CQF. (2026, November 14). Continuous Merton-Kelly Leverage ((mu - r_f)/sigma^2) & Half-Kelly Math. QuantCalc Tools. https://quantcalctools.com/guides/continuous-merton-kelly-leverage-mu-over-sigma-squared-half-kellyRelated Kelly Margin Leverage Sizing & Institutional Briefings
Explore Kelly Margin Leverage Sizing Hub (20) →Kelly Margin Leverage Sizing
Kelly Criterion, Initial/Variation Margin & Liquidation Math: 2026 GuideKelly Margin Leverage Sizing
Multi-Asset Kelly Portfolio Sizing: Inverse-Covariance & Shrinkage MathKelly Margin Leverage Sizing
Drawdown-Constrained Fractional Kelly: Exact Probability of X% Loss MathKelly Margin Leverage Sizing
UK FCA COBS 22.5 & ESMA Retail Leverage Caps & 50% Margin Close-Out MathKelly Margin Leverage Sizing
Isolated Margin vs Cross-Margin Liquidation & Bankruptcy Price FormulasKelly Margin Leverage Sizing
CME SPAN 2 Historical VaR Margin & Futures Maintenance Top-Up MathKelly Margin Leverage Sizing
ISDA SIMM v2.6 Uncleared OTC Initial Margin: Delta, Vega & Curvature MathKelly Margin Leverage Sizing
FX Pip-Value & Lot Sizing Calculator Math: Cross-Currency ConversionMarket Insights
Rayonier jumped after earnings. Why we still see upside for the timber REITMarket Insights
10-year Treasury yield jumps back above 5% as oil gains and more Fed rate hikes expectedVenture Capital
Ukrainian defense tech startup hits $6 billion valuation as investors bet on battle-tested dronesMarket Insights
The stock market 'dodged a real bullet' — Cramer on Anthropic's new IPO valuation
QuantCalc Tools Data, Benchmarks & Contributor Records
CC BY 4.0 Open Data
Open Institutional Datasets (CSV / JSON) →
Download desk-compiled quantitative series & schemas.
2026 Reference Matrix
2026 Institutional Benchmarks & Thresholds →
Statutory capital, clearing, margin & rate conventions.
Editorial Records
Authors & Review Records →
View named contributors where those records are available.
Complete Index
Master Research & Dossier Archive →
Browse all published briefings by topic pillar & date.