
Risk of Ruin Math: Fixed-Dollar Markov Absorption vs Fixed-Fractional Sizing
Betting a constant $2,000 per trade carries an exponential Markov absorption Risk of Ruin (q/p)^N, whereas scaling risk dynamically as a fixed percentage of live equity transforms ruin geometry.
Why can a profitable trader with a verified +55% win rate still blow up an account in six months? Because Risk of Ruin (RoR)—the mathematical probability of hitting an absorbing termination barrier (total $0 wipeout, a prop-firm -10% max loss gate, or an institutional -25% mandate termination) before reaching target wealth—depends hyper-sensitively on whether you bet Fixed Dollars per trade vs Fixed Percentage of Current Equity, and on payoff variance relative to drift! Calibrate survival-safe leverage in our Kelly Criterion Calculator and anchor in our Kelly, Margin & Liquidation Hub.
Exact Derivations: Symmetric Markov Ruin, Asymmetric Characteristic Roots & Brownian Ruin#
Distinguish three classic Risk-of-Ruin regimes:
- Classic Feller (1968) Fixed-Unit Gambler's Ruin ($R = 1:1$): Starting with $U$ fixed risk units (e.g.,
$50,000capital divided into$2,500fixed bets $\implies U = 20$ units) with win probability $p > 0.50$ and loss probability $q = 1 - p < 0.50$, second-order difference equation $Ru = p R{u+1} + q R_{u-1}$ has characteristic roots $\lambda = 1$ and $\lambda = q/p < 1$. - Asymmetric Payoff Fixed-Unit Ruin ($+R$ units won vs $-1$ unit lost): Characteristic polynomial $p \lambda^{R+1} - \lambda + q = 0$ has a unique root $\lambda* \in (0, 1)$ whenever expectancy $p R - q > 0$, giving $\text{RoR}(U) = (\lambda*)^U$.
- Continuous Brownian / Fixed-Fractional Barrier Drawdown Ruin: Scaling bet size $f$ dynamically with current wealth $Wt$ can never literally touch
$0.00in continuous diffusion, so "Ruin" is defined as hitting termination barrier $B = W0(1 - D_{\text{stop}})$!
- 1. Classic Even-Payoff Fixed-Unit Gambler's Ruin (U Risk Units to Termination Barrier, R = 1:1):
- Infinite Target (Survival Forever): RoR = (q / p)^U (if p > q); RoR = 100.0% (if p <= q!)
- Finite Target M Units (M > U) : RoR = [ (q/p)^U - (q/p)^M ] / [ 1 - (q/p)^M ] (When p = 0.5: RoR = 1 - U/M)
- 2. Asymmetric Payoff (+R Win, -1 Loss, p*R > q) — Exact Root + Brownian Diffusion Approximation:
- Exact Polynomial Root : Solve unique root r0 in (0, 1) of p * r^(R + 1) - r + q = 0 => RoR = (r0)^U
- Diffusion Closed Form : Drift muu = p*R - q, Var sigmau^2 = p*R^2 + q - mu_u^2
- RoR(U) ~= exp( -2 * muu * U / sigmau^2 )
- 3. Fixed-Fractional % Sizing Barrier Ruin (Risking fraction r of LIVE equity per trade, Stop Barrier = 1 - D_stop):
- Effective shrinking units to barrier: Ueff = ln(1 - Dstop) / ln(1 - r) (> U_fixed because losses shrink $ bet!)
- Continuous c-Kelly Exact Formula : RoR(Dstop) = (1 - Dstop)^( (2 / c) - 1 )
- Worked Prop-Account Survival Audit ($100,000 Account, Hard Termination at $90,000 => $10,000 Risk Budget, p = 55%, R = 1:1):
- Over-Aggressive Risk ($2,500/trade -> Only U = 4 Fixed Units to Termination!):
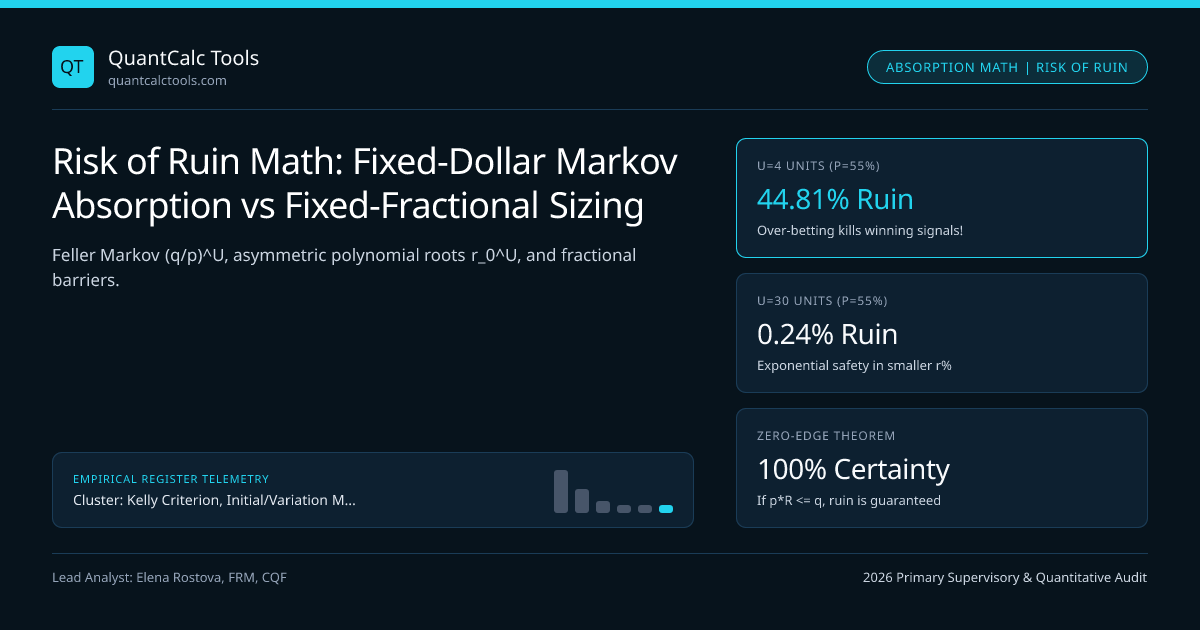
- RoR = (0.45 / 0.55)^4 = (0.81818)^4 = 44.81% CHANCE OF FAILING DESPITE +55% WINNING EDGE!
- Disciplined Institutional Risk ($500/trade -> U = 20 Fixed Units to Termination):
- RoR = (0.45 / 0.55)^20 = (0.81818)^20 = 1.80% Ruin Probability (25x safer simply by cutting ticket size 5x!)
Look at the brutal exponential sensitivity of $(q/p)^U$ in that worked prop-firm audit: changing NOTHING about your trading signal (p = 55%, R = 1:1), risking $2,500 (2.5% toward a -10% floor, $U = 4$ units) carries a 44.81% ruin rate, whereas risking $500 (0.5%, $U = 20$ units) slashes Risk of Ruin to 1.80%—and $250 ($U = 40$ units) drops Risk of Ruin to 0.032% (1-in-3,080)!
Why Fixed-Fractional Anti-Martingale Sizing Beats Fixed-Dollar Sizing to Any Barrier $D_{\text{stop}}$#
Suppose your committee terminates your sleeve at a $D_{\text{stop}} = -30\%$ drawdown.
- Under Fixed-Dollar
$2%of initial capital, hitting-30%takes exactly $30\% / 2\% =$15.0net losing units. - Under Fixed-Fractional
2%of current live equity, each loss multiplies equity by0.98, so hitting0.70takes $U{\text{eff}} = \ln(0.70) / \ln(0.98) = -0.35667 / -0.02020 =$17.65net losing units—gifting you+2.65extra survival units during drawdowns while compounding exponentially faster during winning streaks! (And conversely, Martingale doubling after losses collapses `Ueffto $\log_2(N)$, turning a routine 7-trade losing streak into instant100%` wipeout!)
Exact Infinite-Horizon Risk of Ruin Matrix Across Edge & Unit Cushion ($U$)#
Inspect exact Risk of Ruin across asymmetric payoff ratios $R$, win rates $p$, and risk-unit buffers $U$ to your account's stop-out floor:
Strategy Profile (Win Rate p, Payoff R) | Expectancy / Risk | Characteristic Root ($r_0$) | U = 5 Units (reckless) | U = 15 Units (moderate) | U = 30 Units (institutional) |
|---|---|---|---|---|---|
Zero-Edge Random (p=50%, R=1:1) | $0.00 | $1.0000$ | $100.0\%$ | $100.0\%$ | $100.0\%$ (Guaranteed ruin!) |
Thin Scalper (p=53%, R=1:1) | +$0.06 | $0.8868$ | $54.8\%$ | $16.5\%$ | $2.72\%$ |
Solid Swing (p=55%, R=1.5:1) | +$0.375 | $0.6186$ | $9.05\%$ | $0.074\%$ | $< 0.0001\%$ |
Breakout Trend (p=35%, R=3.0:1) | +$0.40 | $0.7686$ | $26.8\%$ | $1.93\%$ | $0.037\%$ |
Tail Macro (p=22%, R=6.0:1) | +$0.54 | $0.8542$ | $45.5\%$ | $9.41\%$ | $0.89\%$ (Needs U >= 30!) |
Look at the Diffusion Bridge: $\exp(-2 \muu U / \sigmau^2)$ IS the Continuous Kelly Formula!#
Inspect Equation 2's Brownian diffusion exponent $-2 \muu U / \sigmau^2$: notice $\muu / \sigmau^2$ is literally *Merton-Kelly optimal leverage $f^$! Thus drawdown-constrained fractional Kelly, discrete binomial Kelly, and Markov Gambler's Ruin are three projections of the exact same stochastic barrier differential equation**!
Stress-Testing Correlated Losing Streaks via Monte Carlo#
IID Markov formulas assume trade $k+1$ has the same win probability $p$ after five straight losses; in real markets, chop regimes cluster losses (positive streak autocorrelation). Always stress-test non-IID cluster ruin using our Cholesky Monte Carlo Simulator, Ralph Vince Optimal f, and regulated client protection disclosures under the UK FCA.
Frequently asked questions
Why is infinite-horizon Risk of Ruin equal to 100% on a perfectly fair 50/50 zero-commission game?
Because 1D symmetric Brownian motion / simple random walk is neighborhood-recurrent! With zero upward drift (mu = 0) and an absorbing floor at $0 against an unbounded upside (+infinity), the random walk fluctuates ever wider as sqrt(t) and crosses ANY finite lower barrier with probability 1.00 as t -> infinity!
Can a Fixed-Fractional trader ever literally hit $0.00, and why can they still suffer "practical ruin"?
In continuous math, multiplying by (1 - 0.02)^k never reaches literal zero; in real markets, "practical ruin" hits via three floors: (1) Account equity drops below minimum exchange lot/margin size; (2) An allocator or prop firm pulls the plug at -15% or -25% drawdown; or (3) An overnight gap exceeds 1/Leverage!
Why does Martingale betting (doubling bet size after every loss) guarantee eventual blowup?
Winning 1 unit most days feels safe until a routine 1-in-512 nine-loss streak requires staking 2^9 - 1 = 511 units just to win +1 unit—instantly breaching either your total bankroll or the broker’s statutory Initial Margin cap and crystallizing catastrophic ruin! Martingale swaps frequent tiny gains for certain tail wipeout.
How do I calculate the maximum expected consecutive losing streak over N trades for win rate p?
With loss probability q = 1 - p across N independent trades, the expected longest losing run is approximately E[L_max] ~= ln(N * p) / ln(1 / q). For a trend follower with p = 30% (q = 0.70) over N = 500 trades, E[L_max] ~= ln(150) / 0.3567 = 14.0 consecutive losses—size U to survive 2.5x E[L_max]!
Publication record
- Published
- 13 November 2026
- Updated
- 14 November 2026
- Author
- Elena Rostova, FRM, CQF
- Review
- Review not recorded
- Automated fact check
- Passed in the stored pipeline record
- Source URLs
- 4 recorded
AI assistance recorded: anthropic/claude-opus-4.6. This field does not establish human review or source verification.
Academic & Institutional Attribution
Cite This Research & Embed Live Data Card
Standard academic & institutional research paper citation format.
Elena Rostova, FRM, CQF. (2026, November 14). Risk of Ruin Math: Fixed-Dollar Markov Absorption vs Fixed-Fractional Sizing. QuantCalc Tools. https://quantcalctools.com/guides/risk-of-ruin-gamblers-ruin-markov-absorption-fixed-fractional-mathRelated Kelly Margin Leverage Sizing & Institutional Briefings
Explore Kelly Margin Leverage Sizing Hub (20) →Kelly Margin Leverage Sizing
Kelly Criterion, Initial/Variation Margin & Liquidation Math: 2026 GuideKelly Margin Leverage Sizing
Inverse Coin-Margined vs Linear Dollar Perpetual Liquidation & Convexity MathKelly Margin Leverage Sizing
Volatility-Target, Wilder ATR Stop-Loss & Equal Risk Contribution SizingKelly Margin Leverage Sizing
Central Clearing Variation Margin Liquidity Spirals & Cash Buffer MathKelly Margin Leverage Sizing
Ralph Vince Optimal f & Terminal Wealth Relative (TWR): Empirical Sizing MathKelly Margin Leverage Sizing
Short Naked Option Margin Math: Reg T 20%/10% Rule & Gamma Crash ExpansionKelly Margin Leverage Sizing
Repo Haircut, Rehypothecation Multiplier & Leveraged Bond Carry MathKelly Margin Leverage Sizing
Black-Litterman Posterior Expected Return & Bayesian Kelly Sizing MathMarket Insights
Why stocks are falling and 10-year yields are climbing back near 5% after Tuesday’s inflation reportIPO and Stock Market
Anthropic heads for lower than expected $1.3 trillion valuation in stock market debutMarket Insights
Stifel cuts Everus stock price target on valuation resetMarket Insights
JPMorgan lowers ViaSat stock price target to $120 on valuation
QuantCalc Tools Data, Benchmarks & Contributor Records
CC BY 4.0 Open Data
Open Institutional Datasets (CSV / JSON) →
Download desk-compiled quantitative series & schemas.
2026 Reference Matrix
2026 Institutional Benchmarks & Thresholds →
Statutory capital, clearing, margin & rate conventions.
Editorial Records
Authors & Review Records →
View named contributors where those records are available.
Complete Index
Master Research & Dossier Archive →
Browse all published briefings by topic pillar & date.