
Parametric Var Expected Shortfall
FRTB Stressed Expected Shortfall: Reduced-Factor MAR33.5 Calibration Math
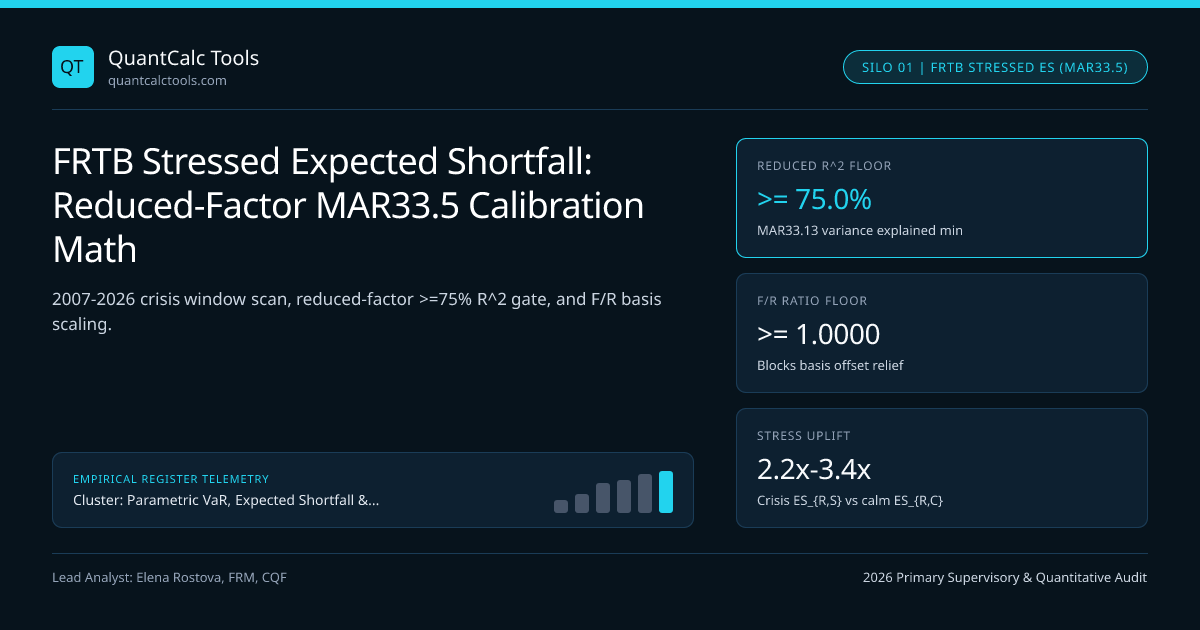
Because full modern risk-factor histories rarely exist back to 2007-2009, Basel III MAR33.5 scales reduced-factor crisis Expected Shortfall by the current full-to-reduced portfolio ratio.
Under Basel 2.5, banks summed current VaR plus a separate Stressed VaR—double-counting baseline risk—yet struggled whenever newly issued SOFR tenors, green sovereign bonds, or modern equity tickers lacked historical time series stretching back to the 2007–2009 Global Financial Crisis! Basel III FRTB MAR33.5 solves both problems simultaneously inside Basel III FRTB 97.5% Expected Shortfall: banks identify a Reduced Set of Risk Factors ($R$) possessing clean continuous histories back to 2007, find the most punitive 12-month stress window ($S$), and scale that stressed figure up to the Full Factor Set ($F$) using today's live portfolio ratio! Benchmark unscaled normal ES in our Value at Risk (VaR) calculator and review the broader architecture in our Parametric VaR & Expected Shortfall calibration guide.
Exact MAR33.5 Indirect Stressed Expected Shortfall Formula#
Every trading day, an IMA bank computes three liquidity-horizon-adjusted 97.5% Expected Shortfall numbers (each already incorporating the 10-to-120-day cascade from Basel FRTB liquidity horizon bucketing):
- $ES{R,S}$: Expected Shortfall of the current portfolio restricted to the Reduced Factor Set ($R$), calibrated over the 12-month Stress Period ($S$) that maximizes $ES{R,S}$ across historical windows since January 2007.
- $ES_{F,C}$: Expected Shortfall of the Full Factor Set ($F$) calibrated over the Current 12-month Period ($C$).
- $ES_{R,C}$: Expected Shortfall of the Reduced Factor Set ($R$) calibrated over the Current 12-month Period ($C$).
Basel MAR33.5 defines Indirect Stressed Expected Shortfall ($IMCC$ base) by scaling $ES{R,S}$ via the floored ratio $\max\!\left(\frac{ES{F,C}}{ES_{R,C}},\, 1.0\right)$:
Worked Basel MAR33.5 Reduced-to-Full Factor Stressed ES Scaling Audit#
- Historical Scan (2007-2026): Worst 12-Month Window S = Sep 2008 to Aug 2009 (Lehman / GFC Peak)
- Current 12-Month Window C = Nov 2025 to Oct 2026:
- Full Factor Set (1,420 modellable factors incl. SOFR OIS & CDS) .. ES_{F,C} = $14,800,000
- Reduced Factor Set (680 core swaps/indices back to 2007) ......... ES_{R,C} = $13,100,000
- Variance Explained Check (MAR33.13 >= 75% Floor):
- Explained Ratio = 1 - Var(PnLFull - PnLReduced) / Var(PnL_Full) = 88.4% >= 75.0% (PASS)
- 1) Full-to-Reduced Scaling Ratio (Floored at 1.0000 by MAR33.5):
- Ratio = max( $14,800,000 / $13,100,000 , 1.0000 ) = 1.12977
- 2) Indirect Stressed Expected Shortfall (IMCC_t):
- Reduced-Set Stress Window Output (Sep 2008 - Aug 2009) .......... ES_{R,S} = $29,400,000
- IMCCt = ES{R,S} * max( ES{F,C} / ES{R,C} , 1.0 )
- = $29,400,000 * 1.12977 = $33,215,267
- 3) Final Modellable Regulatory Capital Charge (MAR33.41, Green Zone m_c = 1.50):
- 60-Day Moving Average IMCC_avg = $31,950,000
- IMA Modellable Capital = max( IMCC{t-1} , mc * IMCC_avg )
- = max( $33,215,267 , 1.50 * $31,950,000 ) = $47,925,000!
Examine two crucial regulatory protections embedded inside that formula:
- Why is $ES{F,C}/ES{R,C}$ floored at $1.0000$? Suppose the omitted basis factors ($F \setminus R$) happen to hedge the core reduced factors during the calm current year $C$, making $ES{F,C} = \$11.5\text{M} < ES{R,C} = \$13.1\text{M}$ ($\text{ratio} = 0.878$). In a 2008-style liquidity freeze, basis correlations routinely invert! Flooring the ratio at $1.0000$ prohibits banks from assuming calm-period basis offsets survive a systemic crisis!
- The 75% Explained Variance Gate (MAR33.13): Banks cannot cherry-pick a tiny benign reduced set $R$ to depress $ES_{R,S}$; the reduced factor set must explain at least 75% of the variance of the full Expected Shortfall portfolio over the preceding 12 months!
Stress Window Shifts: 2008 GFC vs 2020 COVID Dash-for-Cash vs 2022 Gilts/Rates Shock#
A classic mistake in naive risk prototypes is hardcoding Sep 2008 - Aug 2009 as the permanent stress period $S$. Under the FRTB-ES-975 2026 Benchmark Standard supervised by the UK PRA, the stress window $S$ is portfolio-dependent! If a rates desk flips from long credit spreads to short front-end sovereign duration or inflation swaps, 2008 rate cuts might look mild compared with the 2022–2023 central-bank hiking & UK LDI gilt shock!
Historical 12-Month Stress Windows Across Asset Class Portfolios#
| Portfolio Archetype | Winning 12-Month Stress Window ($S$) | Dominant Historical Shock Driver | Typical $ES{R,S} / ES{R,C}$ Uplift |
|---|---|---|---|
| Corporate Credit & Structured Spreads | Sep 2008 – Aug 2009 (GFC) | CDX IG/HY blowout & correlation freeze | $2.40\times$ – $3.10\times$ |
| Equity Dispersion & Short Volatility | Sep 2019 – Aug 2020 (COVID-19) | VIX 82.69 spike & stock-corr jump to $0.88$ | $2.65\times$ – $3.45\times$ |
| Sovereign Rates & LDI Linker Books | Feb 2022 – Jan 2023 (Inflation Hike) | +425 bps policy hikes & 30Y UK Gilt surge | $2.15\times$ – $2.80\times$ |
| European Sovereign Periphery Basis | Jul 2011 – Jun 2012 (Eurozone Debt) | BTP-Bund spread widening & redenomination | $2.05\times$ – $2.55\times$ |
| Energy & Physical Commodity Curves | Jan 2020 – Dec 2020 / 2022 Gas | Negative WTI front futures & TTF backwardation | $2.90\times$ – $4.10\times$ |
Proxy Backfill Governance for Post-2021 Risk-Free Rates (SOFR, SONIA, ESTR)#
How do banks include SOFR, SONIA, and ESTR curves inside the Reduced Factor Set $R$ going back to 2007 when SOFR only began publication in April 2018? Regulatory technical standards permit stitching historical OIS (Fed Funds OIS, EONIA minus $8.5\text{ bps}$ statutory spread, SONIA pre-reform) into continuous synthetic zero curves provided proxy stitching passes desk-level P&L Attribution (PLAT) Spearman rank-correlation ($\ge 0.80$) and Kolmogorov-Smirnov ($< 0.09$) distributional gates! Pair this workflow with Basel Non-Modellable Risk Factors (NMRF) stress math, check backtest multipliers in Kupiec POF likelihood-ratio zones, and explore the Parametric VaR & Expected Shortfall Topic Hub.
Frequently asked questions
Why did Basel III replace Basel 2.5 (VaR + Stressed VaR) with Indirect Stressed Expected Shortfall?
Summing current VaR plus Stressed VaR under Basel 2.5 double-counted capital during live crises (when current VaR equaled Stressed VaR) and required full factor histories back to 2007. MAR33.5 uses a single stressed ES scaled by the current full-to-reduced basis ratio.
What happens if ES_{F,C} is smaller than ES_{R,C} because omitted basis factors hedge core positions?
MAR33.5 floors the multiplier max(ES_{F,C} / ES_{R,C}, 1.0) at 1.0000. Supervisors prohibit reducing stressed ES below ES_{R,S} because basis relationships observed in tranquil markets frequently break down during systemic crises.
How often must a bank re-scan historical 12-month windows since 2007 to update its stress period S?
Banks must re-evaluate candidate 12-month windows across the post-2007 sample at least monthly—or immediately whenever significant portfolio directional shifts (such as flipping from long rates to short rates) alter which historical crisis hurts most.
How do banks populate 2007-2018 history for SOFR swaps inside the Reduced Factor Set?
Supervisors allow splicing historical Fed Funds OIS and repo curves with ISDA/ARRC spread adjustments prior to 2018, provided the stitched proxy series satisfies MAR32 P&L Attribution (Spearman >= 0.80 and KS <= 0.09) on current books.
Publication record
- Published
- 14 November 2026
- Updated
- 14 November 2026
- Author
- Elena Rostova, FRM, CQF
- Review
- Review not recorded
- Automated fact check
- Passed in the stored pipeline record
- Source URLs
- 3 recorded
AI assistance recorded: anthropic/claude-opus-4.6. This field does not establish human review or source verification.
Academic & Institutional Attribution
Cite This Research & Embed Live Data Card
Standard academic & institutional research paper citation format.
Elena Rostova, FRM, CQF. (2026, November 14). FRTB Stressed Expected Shortfall: Reduced-Factor MAR33.5 Calibration Math. QuantCalc Tools. https://quantcalctools.com/guides/stressed-expected-shortfall-frtb-12-month-crisis-window-calibrationRelated Parametric Var Expected Shortfall & Institutional Briefings
Explore Parametric Var Expected Shortfall Hub (20) →Parametric Var Expected Shortfall
Parametric VaR, Expected Shortfall & Fat-Tail Risk Calibration: 2026 Quantitative GuideParametric Var Expected Shortfall
Acerbi-Szekely Expected Shortfall Backtesting: Non-Elicitability & Z2 MathParametric Var Expected Shortfall
Ledoit-Wolf Covariance Shrinkage in Portfolio VaR: Eigenvalue ConditioningParametric Var Expected Shortfall
Correlation Breakdown in Multi-Asset VaR: Stressed-Beta Contagion MathParametric Var Expected Shortfall
Garman-Klass & Yang-Zhang OHLC Volatility: Efficient VaR Input Math GuideParametric Var Expected Shortfall
Lognormal vs Arithmetic Parametric VaR: Multi-Month Horizon Math GuideParametric Var Expected Shortfall
Basel FRTB Non-Modellable Risk Factors (NMRF): RFET & SES Capital MathParametric Var Expected Shortfall
Cornish-Fisher VaR Quantile Expansion: Skewness & Excess Kurtosis Formula GuideBond Duration Convexity Math
TIPS Real-Yield Duration vs Nominal Treasury Empirical Beta Hedging MathBond Duration Convexity Math
Spread Duration vs Duration-Times-Spread (DTS): Credit Hedging MathBond Duration Convexity Math
Floating-Rate Note (FRN) Interest-Rate Reset Duration vs Spread Duration MathBond Duration Convexity Math
Ultra-Long 50Y Gilt & 100Y Century Bond Convexity Asymmetry Math
QuantCalc Tools Data, Benchmarks & Contributor Records
CC BY 4.0 Open Data
Open Institutional Datasets (CSV / JSON) →
Download desk-compiled quantitative series & schemas.
2026 Reference Matrix
2026 Institutional Benchmarks & Thresholds →
Statutory capital, clearing, margin & rate conventions.
Editorial Records
Authors & Review Records →
View named contributors where those records are available.
Complete Index
Master Research & Dossier Archive →
Browse all published briefings by topic pillar & date.