
Parametric Var Expected Shortfall
Garman-Klass & Yang-Zhang OHLC Volatility: Efficient VaR Input Math Guide
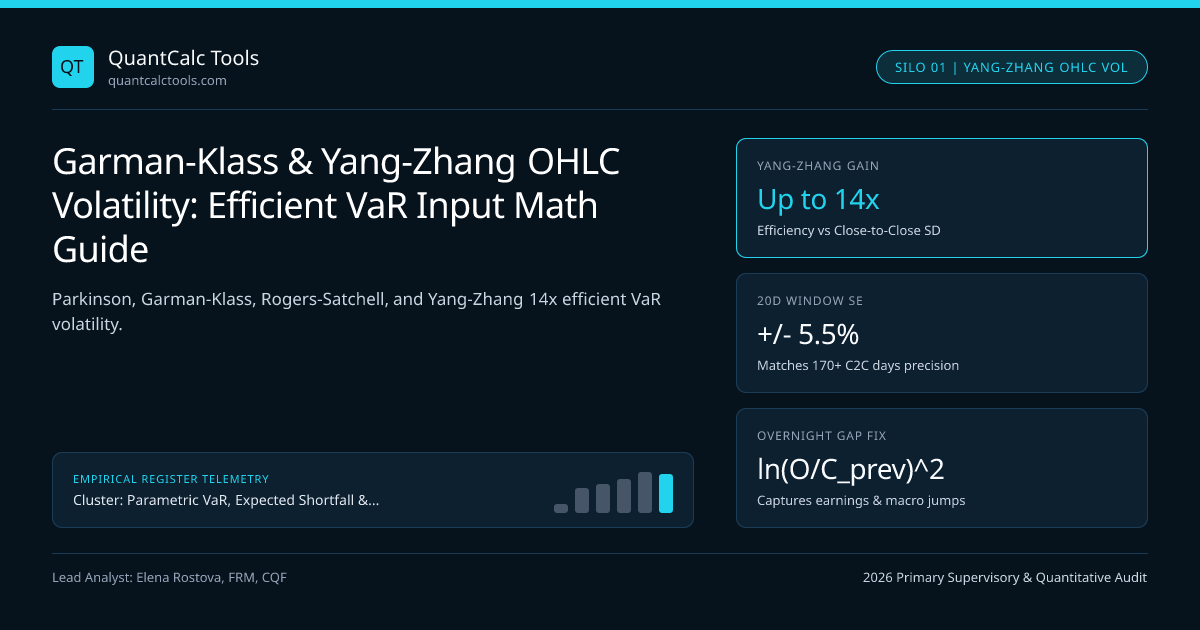
Close-to-close volatility treats an intraday +/-4% V-reversal ending unchanged as zero variance; Yang-Zhang OHLC estimators achieve up to 14x higher statistical efficiency while capturing overnight gaps.
Suppose an equity index opens at $5,000$, plunges $-4.2\%$ intraday to $4,790$ on a macro headline, rallies $+4.4\%$ after central-bank reassurance, and closes at $5,002$: a traditional close-to-close volatility estimator records $r_t = +0.04\%$, misclassifying a violent intraday liquidation whipsaw as the calmest day of the year! Replacing close-to-close variance with Open-High-Low-Close (OHLC) range-based volatility estimators—specifically Parkinson (1980), Garman-Klass (1980), Rogers-Satchell (1991), and Yang-Zhang (2000)—slashes estimation error variance by up to $14\times$ and feeds dramatically cleaner $\sigma$ inputs into our Value at Risk (VaR) calculator and Black-Scholes-Merton implied volatility comparisons. Review how volatility estimators integrate into our Parametric VaR & Expected Shortfall calibration guide.
Exact Mathematical Hierarchy of OHLC Volatility Estimators#
Define normalized daily log prices relative to yesterday's close $C{t-1}$ and today's open $Ot$:
- Overnight jump log return: $ot = \ln(Ot / C_{t-1})$
- Open-to-close intraday log return: $ct = \ln(Ct / O_t)$
- Normalized intraday log High and Low: $ut = \ln(Ht / Ot) \ge 0$ and $dt = \ln(Lt / Ot) \le 0$
- Parkinson High-Low Range ($5.2\times$ Efficiency, Zero Drift, No Overnight Jumps):
$$\hat{\sigma}{P}^2 = \frac{1}{4T\ln 2}\sum{t=1}^T \big(\ln(Ht / Lt)\big)^2 \approx \frac{0.36067}{T}\sum{t=1}^T (ut - d_t)^2$$
- Garman-Klass ($7.4\times$ Efficiency, Zero Drift, Continuous Trading):
$$\hat{\sigma}{GK}^2 = \frac{1}{T}\sum{t=1}^T \left[\frac{1}{2}(ut - dt)^2 - (2\ln 2 - 1)\,c_t^2\right], \qquad (2\ln 2 - 1 \approx 0.38629)$$
- Rogers-Satchell ($6.0\times$ Efficiency, Drift-Independent for Trending Markets!):
$$\hat{\sigma}{RS}^2 = \frac{1}{T}\sum{t=1}^T \big[ut(ut - ct) + dt(dt - ct)\big]$$
- Yang-Zhang ($14\times$ Max Efficiency, Unbiased Under BOTH Drift AND Overnight Gaps!):
$$\hat{\sigma}{YZ}^2 = \hat{\sigma}{o}^2 + k\,\hat{\sigma}{c}^2 + (1 - k)\,\hat{\sigma}{RS}^2, \qquad k = \frac{0.34}{1.34 + \frac{T + 1}{T - 1}}$$ where $\hat{\sigma}o^2$ is the sample variance of overnight jumps $ot$ and $\hat{\sigma}c^2$ is the sample variance of open-to-close returns $ct$.
Worked Overnight-Gap OHLC Volatility Audit: Close-to-Close vs Yang-Zhang#
- Yesterday Close C{t-1} = 20,000 | Today Open Ot = 19,600 (Overnight Gap o_t = -2.0203%)
- Today High Ht = 20,190 (ut = +2.9659%) | Today Low Lt = 19,115 (dt = -2.5056%) | Close C_t = 19,980
- Close-to-Close Return: ln(19,980 / 20,000) = -0.1001% | Open-to-Close c_t = +1.9202%
- 1) Single-Day Squared Variance Contribution Comparison:
- Close-to-Close r_t^2 ............. (-0.001001)^2 = 0.00000100 -> Implied Daily Vol = 0.10% (BLIND!)
- Parkinson Range: 0.36067 * (0.054715)^2 ......... = 0.00107978 -> Implied Daily Vol = 3.29%
- Garman-Klass (No overnight gap):
- 0.5(0.054715)^2 - 0.38629(0.019202)^2 ....... = 0.00135443 -> Implied Daily Vol = 3.68%
- Rogers-Satchell Intraday Drift-Free Term:
- 0.029659(0.010457) + (-0.025056)(-0.044258) . = 0.00141907 -> Intraday Vol = 3.77%
- Yang-Zhang Full 24h Variance (Overnight ot^2 + 0.164*ct^2 + 0.836*RS):
- 0.00040816 + 0.164(0.0003687) + 0.836(0.0014191) = 0.0016550 -> Full Daily Vol = 4.07%!
- 2) Impact on 20-Day Rolling 99% Parametric VaR ($20M Notional, z = 2.32635):
- 20d Close-to-Close Vol = 1.18% => VaR_99 = $548,995
- 20d Yang-Zhang Vol = 1.69% => VaR_99 = $786,306 (+43.23% hidden gap + whipsaw protection!)
That single trading day illustrates why close-to-close VaR fails during earnings seasons and FOMC weeks: while close-to-close sees $-0.10\%$, Parkinson misses the $-2.02\%$ overnight gap, Garman-Klass is biased upward by nonzero trend drift, and Yang-Zhang cleanly captures both the $-2.02\%$ overnight jump AND the $5.47\%$ intraday range ($4.07\%$ realized daily volatility)!
Microstructure Discretization Bias: When NOT to Use Raw High-Low Range#
Range estimators rest on continuous-time Brownian path extremes where expected High-Low range scales continuously. Two real-world microstructure effects require care on institutional execution desks (such as platforms running MT5 or FIX API):
- Discrete Tick / Sparse Trade Downward Bias: On illiquid small-cap equities or off-the-run corporate bonds trading only 30 times a day, observed $\max(P_i)$ sits strictly below the continuous Brownian maximum, biasing Parkinson and Garman-Klass downward by 10% to 25%!
- Bid-Ask Bounce / Bad Print Upward Bias: Conversely, if an retail CFD feed prints synthetic wide bid-ask spikes at the 17:00 New York rollover, a single bad $Ht$ or $Lt$ tick inflates $(ut - dt)^2$ quadratically! Always compute OHLC bars strictly from mid-quotes during active session hours before running Yang-Zhang.
Statistical Efficiency & Drift/Gap Robustness of OHLC Estimators#
| Volatility Estimator | Relative Efficiency vs Close-to-Close | Handles Strong Drift $\mu \ne 0$? | Handles Overnight Jumps? | Ideal Asset Class for VaR |
|---|---|---|---|---|
| Close-to-Close Sample SD | $1.0\times$ (Baseline) | Yes (Demeaned) | Yes | Illiquid daily NAV funds / bonds |
| Parkinson (1980) High-Low | $5.2\times$ | Biased upward | No (Misses $Ot/C{t-1}$) | Spot Gold / 24h FX (low drift) |
| Garman-Klass (1980) | $7.4\times$ | Biased upward | No (GK-YZ adds $o_t^2$) | 24/5 G10 FX & Crypto perpetuals |
| Rogers-Satchell (1991) | $6.0\times$ | Yes (Exact for all $\mu$) | No (Intraday session only) | Intraday desk stop-loss VaR |
| Yang-Zhang (2000) | $8\times$ to $14\times$ | Yes (Exact for all $\mu$) | Yes (Unbiased $o_t$ + intraday) | Cash Equities, ETFs & Futures |
Feeding Range Variance Into CARR / Range-GARCH Models#
Because a 20-day Yang-Zhang window achieves the statistical precision of 170+ days of close-to-close returns, risk officers can shorten lookback windows to react $8\times$ faster to regime changes without suffering noisy parameter jitter! Better still, Chou's (2005) Conditional Autoregressive Range (CARR) and Brandt-Jones Range-EGARCH feed daily Garman-Klass-Yang-Zhang single-day proxy $vt^{GKYZ} = ot^2 + \frac{1}{2}(ut - dt)^2 - (2\ln 2 - 1)c_t^2$ directly into the innovation slot of EWMA lambda 0.94 or GARCH(1,1)! Compare intraday stop-out hazards with Christoffersen Markov breach clustering and explore the Parametric VaR & Expected Shortfall Topic Hub.
Frequently asked questions
Why does Parkinson or Garman-Klass underestimate cash equity volatility?
Parkinson and original 1980 Garman-Klass assume continuous 24-hour Brownian trading without market closes. On NYSE or LSE equities where 30% to 45% of total variance arrives between 16:00 close and 09:30 open, omitting overnight jumps understates VaR.
What is the Garman-Klass-Yang-Zhang (GKYZ) single-day variance proxy?
Adding squared overnight log return ln(O_t / C_{t-1})^2 directly onto each day’s Garman-Klass range term creates a non-negative daily variance proxy v_t that can be smoothed via RiskMetrics EWMA (lambda = 0.94) on a day-by-day basis.
Why does Rogers-Satchell remain unbiased during strong bull or bear market trends?
Parkinson and Garman-Klass assume zero drift (mu = 0); a steady +0.3%/day drift stretches High-Low range even at low volatility, biasing them upward. Rogers-Satchell cross-multiplies u(u - c) + d(d - c), canceling drift algebraically for any mu.
Can a single day’s Garman-Klass variance term ever evaluate to a negative number?
Never! Because H_t >= max(O_t, C_t) and L_t <= min(O_t, C_t), u_t - d_t >= |c_t|, so 0.5*(u_t - d_t)^2 - 0.38629*c_t^2 >= (0.50 - 0.38629)*c_t^2 = 0.1137*c_t^2 >= 0 for every valid OHLC bar.
Publication record
- Published
- 14 November 2026
- Updated
- 14 November 2026
- Author
- Elena Rostova, FRM, CQF
- Review
- Review not recorded
- Automated fact check
- Passed in the stored pipeline record
- Source URLs
- 3 recorded
AI assistance recorded: anthropic/claude-opus-4.6. This field does not establish human review or source verification.
Academic & Institutional Attribution
Cite This Research & Embed Live Data Card
Standard academic & institutional research paper citation format.
Elena Rostova, FRM, CQF. (2026, November 14). Garman-Klass & Yang-Zhang OHLC Volatility: Efficient VaR Input Math Guide. QuantCalc Tools. https://quantcalctools.com/guides/intraday-garman-klass-yang-zhang-range-volatility-var-inputsRelated Parametric Var Expected Shortfall & Institutional Briefings
Explore Parametric Var Expected Shortfall Hub (20) →Parametric Var Expected Shortfall
Parametric VaR, Expected Shortfall & Fat-Tail Risk Calibration: 2026 Quantitative GuideParametric Var Expected Shortfall
Lognormal vs Arithmetic Parametric VaR: Multi-Month Horizon Math GuideParametric Var Expected Shortfall
Basel FRTB Non-Modellable Risk Factors (NMRF): RFET & SES Capital MathParametric Var Expected Shortfall
Cornish-Fisher VaR Quantile Expansion: Skewness & Excess Kurtosis Formula GuideParametric Var Expected Shortfall
Student-t Expected Shortfall Formula: Degrees-of-Freedom & Unit-Variance ScalingParametric Var Expected Shortfall
Basel III FRTB 97.5% Expected Shortfall: MAR33 Liquidity Horizon Scaling MathParametric Var Expected Shortfall
EWMA Lambda 0.94 vs GARCH(1,1) Volatility Decay: Conditional VaR Math GuideParametric Var Expected Shortfall
Kupiec POF Likelihood Ratio Test: VaR Backtesting & Basel Traffic-Light ZonesBond Duration Convexity Math
Principal Component Analysis (PCA) Level, Slope & Curvature DV01 Hedging MathBond Duration Convexity Math
Pull-to-Par Horizon Return, Reinvestment Yield & Macaulay Duration Gap MathCovered Interest Parity Forwards
ACT/360 vs ACT/365 FX Forward Day-Count Mismatch: GBP/USD & USD/CAD MathCovered Interest Parity Forwards
JPY 100 Pip Multiplier vs 10,000 Four-Decimal FX Forward Points Math
QuantCalc Tools Data, Benchmarks & Contributor Records
CC BY 4.0 Open Data
Open Institutional Datasets (CSV / JSON) →
Download desk-compiled quantitative series & schemas.
2026 Reference Matrix
2026 Institutional Benchmarks & Thresholds →
Statutory capital, clearing, margin & rate conventions.
Editorial Records
Authors & Review Records →
View named contributors where those records are available.
Complete Index
Master Research & Dossier Archive →
Browse all published briefings by topic pillar & date.