
Black-Litterman Posterior Expected Return & Bayesian Kelly Sizing Math
Feeding raw historical sample means into multi-asset Kelly creates wild corner portfolios; anchor expected returns in Black-Litterman market equilibrium and scale views by Bayesian posterior precision.
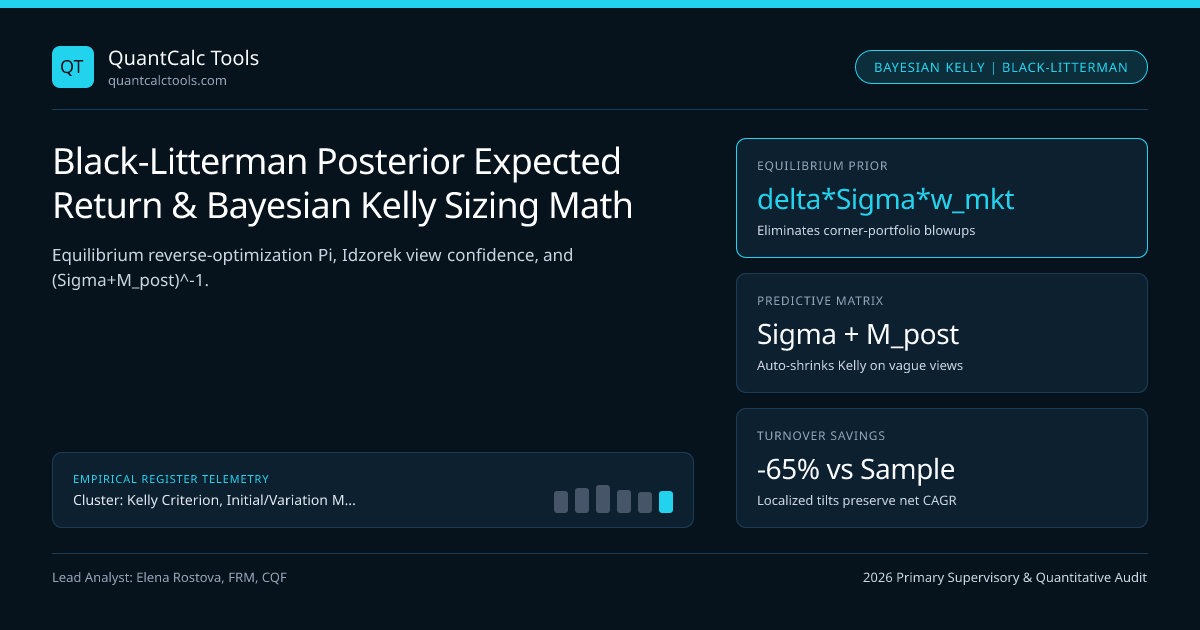
Ask any institutional Chief Investment Officer why raw Markowitz and Multi-Asset Kelly $\boldsymbol{\Sigma}^{-1}(\hat{\boldsymbol{\mu}} - r_f\mathbf{1})$ fail when fed 5-year historical average returns $\hat{\boldsymbol{\mu}}$, and they will point to the "Garbage-In, Corner-Portfolio-Out" problem: if European equities happened to trail US equities by -4% over the past 36 months, raw $\boldsymbol{\Sigma}^{-1}\hat{\boldsymbol{\mu}}$ commands a -300% short in Europe and +400% long in two US sectors, shifting weights by 80% when you change a single expected return by 25 bps! Developed at Goldman Sachs by Fischer Black and Robert Litterman (1991, 1992), the Black-Litterman (BL) Bayesian Model cures mean-input instability permanently—and as Jay Walters and Attilio Meucci showed, incorporating the Posterior Estimation Covariance $\boldsymbol{\Sigma}{\text{BL}}^{\text{pred}} = \boldsymbol{\Sigma} + \mathbf{M}{\text{post}}$ into Fractional Kelly automatically shrinks leverage in exact proportion to view uncertainty! Test shrunk outputs in our Kelly Criterion Calculator and Kelly, Margin & Liquidation Hub.
Exact Three-Step Black-Litterman Posterior & Predictive Bayesian Kelly Equations#
Instead of starting from zero or noisy sample means, Black-Litterman starts from a neutral market-clearing prior: if the global investable market-cap portfolio $\mathbf{w}{\text{mkt}}$ is held in aggregate equilibrium with risk-aversion $\delta = (\mathbb{E}[Rm] - rf)/\sigmam^2$, reverse-optimizing gives Implied Equilibrium Excess Returns $\boldsymbol{\Pi} = \delta \boldsymbol{\Sigma} \mathbf{w}_{\text{mkt}}$! Next, blend $\boldsymbol{\Pi}$ (uncertainty $\tau \boldsymbol{\Sigma}$, typically $\tau \in [0.025, 0.05]$) with $K$ linear Absolute or Relative Alpha Views $\mathbf{P}\boldsymbol{\mu} \sim \mathcal{N}(\mathbf{Q}, \boldsymbol{\Omega})$ via Bayes' Rule, and plug the Predictive Return Distribution $\mathcal{N}(\boldsymbol{\mu}{\text{BL}}, \boldsymbol{\Sigma} + \mathbf{M}{\text{post}})$ directly into Half-Kelly!
- 1. Reverse-Optimized Equilibrium Prior : Pi = delta * Sigma * w_mkt, Prior: mu ~ N(Pi, tau * Sigma)
- 2. Investor Views (K x N Pick Matrix P): P * mu = Q + epsilon, epsilon ~ N(0, Omega)
- He & Litterman Canonical View Uncertainty: Omega = diag( P * (tau * Sigma) * P^T ) / Confidence_Scalar
- 3. Exact Bayesian Posterior Mean (muBL) & Posterior Mean-Uncertainty (Mpost):
- M_post = [ (tau * Sigma)^(-1) + P^T * Omega^(-1) * P ]^(-1)
- muBL = Mpost * [ (tau * Sigma)^(-1) * Pi + P^T * Omega^(-1) * Q ]
- (Equivalent Woodburry Form: mu_BL = Pi + tauSigmaP^T * [PtauSigmaP^T + Omega]^(-1) (Q - P*Pi)!)
- 4. Predictive Return Covariance & Bayesian Fractional c-Kelly Vector (Accounts for Parameter Uncertainty!):
- Sigmapredictive = Sigma + Mpost
- fBayesKelly = c ( Sigma + Mpost )^(-1) * muBL
- Worked Relative-View Property (3-Asset Universe: 60% US Eq, 30% Intl Eq, 10% EM Eq; Investor Has ONLY 1 View!):
- View: "US Eq will outperform Intl Eq by +2.00% (Q = +0.02), P = [+1, -1, 0], 50% confidence; NO VIEW on EM Eq!"
- Naive Optimizer Tweaking US +1% / Intl -1%: Accidentally distorts EM Eq weight due to cross-correlations!
- Exact Black-Litterman Kelly Solution:
- Tilts ONLY the [+1 US, -1 Intl] spread smoothly above w_mkt while keeping EM Eq at EXACT neutral 10.0% market weight!
The Clean Two-Fund Separation Theorem of Black-Litterman Relative Views#
Marvel at that Clean Relative-View Theorem in the worked example! When you express a single relative view (P = [+1, -1, 0], "US beats Europe by +2%") in Black-Litterman and feed $(\boldsymbol{\mu}{\text{BL}}, \boldsymbol{\Sigma} + \mathbf{M}{\text{post}})$ into Kelly, Black-Litterman proved algebraically that the optimal portfolio is a pure linear combination of ONLY TWO portfolios: the Global Market-Cap Portfolio $\mathbf{w}_{\text{mkt}}$ PLUS a clean dollar-neutral tilting overlay in the exact view portfolio $\mathbf{P}^\top$—zero bizarre -300% phantom weights in assets you expressed no view on!
Thomas Idzorek's (2005) Intuitive 0%–100% View Confidence Calibration for $\boldsymbol{\Omega}$#
Practitioners used to struggle choosing abstract diagonal variances in $\boldsymbol{\Omega}$ ("What variance equals moderate conviction on +200 bps?"). Thomas Idzorek solved this elegantly: specify intuitive Confidence % $c_k \in (0\%, 100\%)$ on each view $k$, where $0\%$ gives $\mathbf{w}{\text{mkt}}$ and $100\%$ gives the full certainty weight $\mathbf{w}{100\%}$, and set $\omegak = \frac{1 - ck}{ck} \cdot \mathbf{p}k (\tau \boldsymbol{\Sigma}) \mathbf{p}_k^\top$!
- At $ck = 50\%$ confidence, $\omegak = \mathbf{p}k(\tau\boldsymbol{\Sigma})\mathbf{p}k^\top$ (recovering He & Litterman's exact
1:1prior-vs-view weight!). - At $ck \to 0\%$, $\omegak \to \infty$ (view ignored smoothly!).
Comparison of Expected-Return Priors Inside Multi-Asset Kelly Engines#
Compare portfolio stability, turnover, and out-of-sample compounding across four expected-return input architectures:
| Expected-Return Prior ($\boldsymbol{\mu}$) | Unconstrained Weight Behavior | Sensitivity to $\pm 20\text{ bps}$ Tweak | View Integration? | Out-of-Sample Kelly Stability |
|---|---|---|---|---|
| Raw 5-Year Sample Mean ($\hat{\boldsymbol{\mu}}$) | Extreme $\pm 400\%$ corner weights! | Violent (60%+ turnover swing) | Ad-hoc overrides break everything | Very Poor (Chases past 5y winners) |
| Jorion (1986) Bayes-Stein Grand Mean | Pulls toward Minimum-Variance book | Moderate | None (statistical shrinkage only) | Good defensive baseline |
| Equal Sharpe Prior ($\mui \propto \sigmai$) | Proportional to Inverse-Vol / ERC | Stable | None | Solid macro risk-parity baseline |
| Black-Litterman Posterior ($\boldsymbol{\mu}_{\text{BL}}$) | Anchored to $\mathbf{w}_{\text{mkt}}$ + View Tilts! | Smooth & Localized (< 4% shift) | Exact Absolute & Relative (P, Q) | Institutional Gold Standard! |
Connecting Systematic Factor Z-Scores Directly Into Black-Litterman Q!#
Notice the fourth metric box above (Q = IC * sigma_residual * Z_score): quantitative multi-asset pods bridge Grinold-Kahn's Fundamental Law directly into Black-Litterman by setting view vector $\mathbf{Q} = \text{IC} \cdot \boldsymbol{\sigma}{\text{res}} \odot \mathbf{z}{\text{signal}}$ and view covariance $\boldsymbol{\Omega}$ from signal backtest standard error (deflated via Deflated Sharpe Ratio)! Pair with Ledoit-Wolf covariance shrinkage and Cholesky Monte Carlo stress testing.
Frequently asked questions
Why does Black-Litterman set the prior covariance to tau * Sigma with a small scalar tau ~= 0.025 to 0.05?
Because the uncertainty in the MEAN expected return vector mu is much smaller than the single-period variance Sigma of realized returns! Over T = 20 to 40 years of equilibrium history, standard error of the mean covariance scales as (1 / T) * Sigma = 0.025 * Sigma to 0.05 * Sigma.
How do I calculate the global market risk-aversion parameter delta in Pi = delta * Sigma * w_mkt?
Divide the long-run expected market equity/multi-asset excess risk premium (E[R_mkt] - r_f, typically ~5.0%–5.5%) by the variance of the market-cap portfolio sigma_mkt^2 = w_mkt^T * Sigma * w_mkt (typically ~0.15^2 = 0.0225), giving delta ~= 5.5% / 2.25% ~= 2.4 to 2.6.
Can Black-Litterman handle views on volatility, correlations, or fat-tail crashes rather than just linear expected returns?
Classic 1992 Black-Litterman handles linear Gaussian mean views only. Attilio Meucci’s (2008) "Entropy Pooling" (Fully Flexible Views) generalizes Black-Litterman to ANY non-normal Monte Carlo scenario distribution—re-weighting scenario probabilities via minimum Kullback-Leibler divergence to match views on VaR, correlations, or skewness!
Why must the rows of a relative view in Pick Matrix P sum to 0 while an absolute view sums to 1?
An absolute view ("Gold will return +8% excess") places +1.0 in Gold’s column (row sum = 1). A relative view ("Semiconductors will beat Utilities by +4%") places +1.0 on Semis and -1.0 on Utilities (or market-cap weights summing to +1 on multi-stock winners and -1 on losers, net row sum = 0).
Publication record
- Published
- 13 November 2026
- Updated
- 14 November 2026
- Author
- Elena Rostova, FRM, CQF
- Review
- Review not recorded
- Automated fact check
- Passed in the stored pipeline record
- Source URLs
- 4 recorded
AI assistance recorded: anthropic/claude-opus-4.6. This field does not establish human review or source verification.
Academic & Institutional Attribution
Cite This Research & Embed Live Data Card
Standard academic & institutional research paper citation format.
Elena Rostova, FRM, CQF. (2026, November 14). Black-Litterman Posterior Expected Return & Bayesian Kelly Sizing Math. QuantCalc Tools. https://quantcalctools.com/guides/black-litterman-posterior-expected-return-kelly-bayesian-sizingRelated Kelly Margin Leverage Sizing & Institutional Briefings
Explore Kelly Margin Leverage Sizing Hub (20) →Kelly Margin Leverage Sizing
Kelly Criterion, Initial/Variation Margin & Liquidation Math: 2026 GuideKelly Margin Leverage Sizing
Guaranteed Stop-Loss Order (GSLO) Premium vs Gap Slippage & Option MathKelly Margin Leverage Sizing
Discrete Binomial Kelly Criterion: Win Rate & Asymmetric Payoff ProofKelly Margin Leverage Sizing
Continuous Merton-Kelly Leverage ((mu - r_f)/sigma^2) & Half-Kelly MathKelly Margin Leverage Sizing
Multi-Asset Kelly Portfolio Sizing: Inverse-Covariance & Shrinkage MathKelly Margin Leverage Sizing
Drawdown-Constrained Fractional Kelly: Exact Probability of X% Loss MathKelly Margin Leverage Sizing
UK FCA COBS 22.5 & ESMA Retail Leverage Caps & 50% Margin Close-Out MathKelly Margin Leverage Sizing
Isolated Margin vs Cross-Margin Liquidation & Bankruptcy Price FormulasIPO and Markets
Anthropic's $1.5 trillion IPO valuation in doubt after tech sell-off hammers the marketRegulatory Benchmarks
UK & Quantitative Margin-Regulated Execution 2026 Licensing Benchmark: 6D Prudential Scorecard Across 57 Audited EntitiesCompliance Forensics
How to Verify UK & Quantitative Margin-Regulated Execution Licences & Detect Clone Firms: 2026 Supervisory Lookup PlaybookSolvency and Protection
Investor Compensation Ceilings, Client-Money Segregation & Counterparty Risk Matrix in UK & Quantitative Margin-Regulated Execution (2026)
QuantCalc Tools Data, Benchmarks & Contributor Records
CC BY 4.0 Open Data
Open Institutional Datasets (CSV / JSON) →
Download desk-compiled quantitative series & schemas.
2026 Reference Matrix
2026 Institutional Benchmarks & Thresholds →
Statutory capital, clearing, margin & rate conventions.
Editorial Records
Authors & Review Records →
View named contributors where those records are available.
Complete Index
Master Research & Dossier Archive →
Browse all published briefings by topic pillar & date.