
CAGR vs IRR, Volatility Drag, Sharpe/Sortino & Drawdown Recovery: 2026 Guide
Terminal wealth compounds at the geometric mean rather than the arithmetic average; this quantitative hub unifies CAGR vs XIRR return attribution, variance drain, autocorrelation-adjusted Sharpe and Sortino ratios, and path-dependent drawdown math.
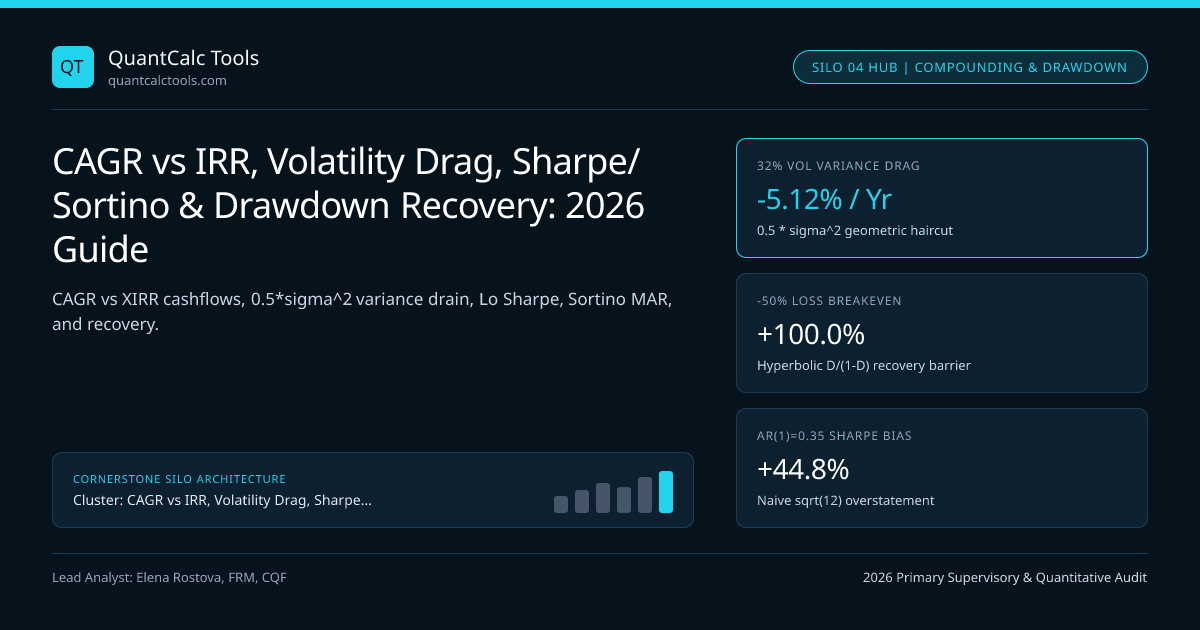
Compounding multiplicative returns across volatile market cycles introduces non-linear mathematical distortions that linear arithmetic averages conceal. Two institutional managers reporting the exact same $+10.0\%$ arithmetic annual mean over a decade will deliver radically different terminal capital if one runs at $8\%$ annualized volatility and the other at $32\%$ volatility: the high-volatility book surrenders roughly $\frac{1}{2}\sigma^2 = 5.12\%$ of annualized growth purely to variance drain. Equally critical, evaluating external investor subscriptions via Money-Weighted Internal Rate of Return (XIRR) versus manager skill via Time-Weighted Compound Annual Growth Rate (CAGR) per Global Investment Performance Standards (GIPS) can flip an apparent $+14\%$ outperformer into a $-3\%$ wealth destroyer. This quantitative pillar hub connects our live CAGR & Volatility Drag Calculator and Sharpe & Sortino Ratio Calculator with 19 specialized derivations spanning return attribution, higher-moment risk-adjusted ratios, sequence-of-returns ruin, and fee-adjusted compounding.
Arithmetic Mean vs Geometric CAGR and Time-Weighted vs Money-Weighted Attribution#
Every institutional performance audit begins by separating time-series compounding from external cashflow timing. Applying Ito's Lemma to geometric Brownian motion $dSt / St = \mu\,dt + \sigma\,dW_t$ proves that continuous log-wealth grows at drift $\mu - \frac{1}{2}\sigma^2$, establishing why variance acts as a deterministic tax on terminal capital even when expected single-period returns remain constant. When external capital enters or exits mid-year, GIPS mandates sub-period linking via Time-Weighted Rate of Return (TWRR) to judge the portfolio manager, whereas private-equity LPs solve polynomial roots via Newton-Raphson XIRR to measure capital-weighted IRR:
- Variance Drain & Log Additivity: Derive the exact Taylor expansion and lognormal wealth dispersion in arithmetic vs geometric return variance drain, and resolve why log returns sum across time while simple returns sum across assets in continuous log-return time additivity vs cross-sectional weights.
- TWRR vs XIRR, MIRR & Dietz Approximations: Reconcile $1{,}100\text{ bps}$ investor timing gaps in TWRR CAGR vs MWRR XIRR cashflow divergence, eliminate non-unique polynomial IRR roots in XIRR Newton-Raphson convergence and Modified IRR, and benchmark daily-valuation shortcuts in Simple vs Modified Dietz sub-period cashflow weighting.
- CAGR (TWRR) = [ Product{t=1..N} (1 + Rt) ]^(1 / Tyears) - 1 ~= Rarith - 0.5 * sigma^2 + (skew / 6)*sigma^3
- XIRR (MWRR) : Solve Sum{k=0..M} [ CFk / (1 + XIRR)^((dk - d0) / 365) ] = 0
- Breakeven Gain from Drawdown D: Greq = D / (1 - D) (e.g., D = 50% -> Greq = +100.0%)
- Lo (2002) Autocorrelated Sharpe: SR(q) = [ q / sqrt(q + 2 * Sum{k=1..q-1} (q - k)*rhok) ] * SR_1
- Sortino Ratio (MAR = tau) : (CAGR - tau) / sqrt( (1/N) * Sum{t=1..N} min(0, Rt - tau)^2 )
- Worked 10-Year Volatility Drag & Drawdown Audit ($1,000,000 Initial Capital):
- Strategy A (Low Vol) : R_arith = 10.0%, sigma = 8.0% -> CAGR ~= 10.0% - 0.32% = 9.68% -> Terminal = $2,519,420
- Strategy B (High Vol): R_arith = 10.0%, sigma = 32.0% -> CAGR ~= 10.0% - 5.12% = 4.88% -> Terminal = $1,610,320
- Pure Variance Drain Penalty over 10 Years = -$909,100 (-36.1% terminal wealth lost to volatility!)
Sharpe Autocorrelation Haircuts, Downside Sortino, Omega & Selection Bias#
Standardizing excess returns by total standard deviation $\sigma$ suffers from three fatal institutional flaws when applied blindly to credit, private real estate, option-writing, or quantitative backtests: serial smoothing understates $\sigma$, upside rallies inflate $\sigma$ unfairly, and mining $K = 500$ parameter combinations guarantees false discoveries. Our Lo (2002) Autocorrelation-Adjusted Sharpe Engine, Sortino Downside Semi-Deviation Engine, and Omega & Calmar Drawdown Engine correct each flaw explicitly:
- Higher-Moment & Serial-Correlation Corrections: Deflate smoothed monthly hedge-fund returns in Lo (2002) serial autocorrelation Sharpe haircut, compute exact continuous lower partial moments $LPM_2(\tau)$ in Sortino target downside semi-deviation math, capture all moments via cumulative distribution integrals in Omega ratio threshold partition math, and penalize data-snooped backtests in Probabilistic & Deflated Sharpe Ratio (DSR).
- Benchmark Relative & Systematic Factor Ratios: Separate active manager skill from breadth $IR = IC \cdot \sqrt{BR}$ in Information Ratio and Grinold-Kahn Fundamental Law, and compare beta-scaled portfolios in Treynor ratio, Jensen's alpha, and Modigliani M-squared.
Asymmetric Drawdown Hyperbolas, Calmar/Ulcer Ratios & Sequence-of-Returns Ruin#
Because portfolio losses shrink the capital base on which subsequent gains compound, drawdown recovery follows a steep hyperbola $G_{\text{req}} = D / (1 - D)$: a $20\%$ loss needs $+25\%$, a $50\%$ loss needs $+100\%$, and an $80\%$ loss requires $+400\%$ just to break even. Path-dependent risk engines therefore pair point-in-time volatility with underwater depth and duration:
- Drawdown Geometry & Brownian Bounds: Quantify recovery horizons in asymmetric drawdown recovery hyperbola math, integrate underwater depth-squared via Martin's Ulcer Index in Calmar, Sterling, and Ulcer Performance Index, and benchmark realized losses against theoretical drift bounds in Magdon-Ismail expected maximum drawdown for Brownian motion.
- Decumulation Ruin, Rebalancing Bonus & Beta Slippage: Prove why two retirees earning the exact same $10$-year $7.5\%$ CAGR can end with either $\$1.48\text{M}$ or complete depletion in sequence-of-returns withdrawal ruin math, harvest cross-asset dispersion via Shannon's Demon constant-weight rebalancing bonus, and model path decay in daily leveraged ETF beta slippage and volatility drag.
Cross-Metric Comparison Matrix: CAGR, XIRR, Lo Sharpe, Sortino & Ulcer UPI#
Select the exact compounding or risk-adjusted denominator demanded by your cashflow governance and return distribution:
| Performance / Risk Metric | Formula / Denominator | Cashflow or Path Sensitivity | Primary Institutional Use Case & Calculator |
|---|---|---|---|
| Time-Weighted CAGR (TWRR) | $[\prod (1 + R_t)]^{1/T} - 1$ | Immune to external cashflows | GIPS manager evaluation (CAGR Calculator) |
| Money-Weighted XIRR | $\sum CFk / (1 + r)^{\Delta dk/365} = 0$ | Heavily weighted to largest capital | Private equity LP & personal wealth attribution |
| Lo (2002) Adjusted Sharpe | $(\mu - rf) / \sigma{\text{Lo}(q)}$ | Penalizes positive AR(1) smoothing | Illiquid credit, CTA & multi-strategy benchmark |
| Sortino Ratio ($LPM_2$) | $(\text{CAGR} - \tau) / \sigma_{\text{down}}(\tau)$ | Penalizes returns below MAR $\tau$ only | Asymmetric macro, trend-following & Sharpe/Sortino Tool |
| Ulcer Performance Index | $(\text{CAGR} - rf) / \sqrt{\frac{1}{N}\sum Dt^2}$ | Penalizes both depth AND time underwater | Systematic CTA & endowment allocator mandates |
Real After-Tax Compounding, Hedge-Fund 2-and-20 Drag & Regulatory Standards#
Nominal pre-fee backtests systematically overstate spendable investor wealth because management fees compound unconditionally, incentive crystallizations act as a free annual call option above High-Water Marks, and annual capital-gains realization destroys deferred tax compounding. Complete your compounding audit with hedge-fund 2-and-20 High-Water Mark net CAGR erosion and Fisher exact real CAGR after inflation and annual tax drag.
Browse all 20 guides on the CAGR, Volatility Drag & Drawdown Topic Hub, audit multi-asset execution accounts in our broker lookup directory, and verify performance advertising rules on the UK FCA regulatory register.
Frequently asked questions
Why does a portfolio with a +50% year and a -50% year lose 25% of its capital despite a 0% average return?
Because returns multiply rather than add: (1 + 0.50) * (1 - 0.50) = 1.50 * 0.50 = 0.75, leaving $0.75 per dollar (-13.40% annualized CAGR over 2 years). The +50% gain applied to $1.00, whereas the -50% loss applied to the enlarged $1.50 base (losing $0.75).
When should an allocator use CAGR (TWRR) versus XIRR (MWRR) to evaluate an investment?
Use CAGR (Time-Weighted Return) whenever evaluating a liquid fund manager who does not control when clients deposit or redeem cash. Use XIRR (Money-Weighted IRR) for private equity/venture capital funds where the GP calls and distributes capital at discretion, or to audit your personal dollar wealth experience.
How does the Sortino ratio improve upon the Sharpe ratio for positively skewed strategies?
The Sharpe ratio penalizes upside return spikes (+40% months) identically to -40% crashes because standard deviation squares all deviations around the mean. Sortino replaces total sigma with target downside deviation below a Minimum Acceptable Return (MAR), avoiding false penalties on convex upside rallies.
Does a higher CAGR guarantee a safer retirement withdrawal stream?
No! Sequence-of-returns risk breaks CAGR invariance once fixed dollar withdrawals begin. Experiencing -20% losses in Years 1–2 while withdrawing living expenses permanently liquidates shares before a Year 8–10 bull market can compound them, depleting a portfolio that had a +7.5% underlying index CAGR.
Publication record
- Published
- 14 November 2026
- Updated
- 14 November 2026
- Author
- Elena Rostova, FRM, CQF
- Review
- Review not recorded
- Automated fact check
- Passed in the stored pipeline record
- Source URLs
- 4 recorded
AI assistance recorded: anthropic/claude-opus-4.6. This field does not establish human review or source verification.
Academic & Institutional Attribution
Cite This Research & Embed Live Data Card
Standard academic & institutional research paper citation format.
Elena Rostova, FRM, CQF. (2026, November 14). CAGR vs IRR, Volatility Drag, Sharpe/Sortino & Drawdown Recovery: 2026 Guide. QuantCalc Tools. https://quantcalctools.com/guides/cagr-irr-volatility-drag-sharpe-sortino-drawdown-recovery-guideRelated Cagr Irr Drawdown Compounding & Institutional Briefings
Explore Cagr Irr Drawdown Compounding Hub (20) →Cagr Irr Drawdown Compounding
Arithmetic vs Geometric Mean Return: 0.5*Sigma^2 Variance Drain DerivationCagr Irr Drawdown Compounding
TWRR (CAGR) vs MWRR (XIRR): Irregular Cashflow Timing Divergence MathCagr Irr Drawdown Compounding
XIRR Newton-Raphson Convergence, Descartes Multiple Roots & MIRR MathCagr Irr Drawdown Compounding
Asymmetric Drawdown Recovery Hyperbola & Breakeven Compounding Time MathCagr Irr Drawdown Compounding
Sharpe Ratio IID Annualization Trap & Lo (2002) Autocorrelation HaircutCagr Irr Drawdown Compounding
Sortino Ratio & Target Downside Semi-Deviation (MAR): Exact LPM2 MathCagr Irr Drawdown Compounding
Calmar, Sterling & Ulcer Performance Index: Path-Dependent Drawdown MathCagr Irr Drawdown Compounding
Omega Ratio Threshold Partition (LPM1): Full-Distribution Skew & Kurtosis MathKelly Margin Leverage Sizing
Kelly Criterion, Initial/Variation Margin & Liquidation Math: 2026 GuideParametric Var Expected Shortfall
Cornish-Fisher VaR Quantile Expansion: Skewness & Excess Kurtosis Formula GuideParametric Var Expected Shortfall
Student-t Expected Shortfall Formula: Degrees-of-Freedom & Unit-Variance ScalingParametric Var Expected Shortfall
Basel III FRTB 97.5% Expected Shortfall: MAR33 Liquidity Horizon Scaling Math
QuantCalc Tools Data, Benchmarks & Contributor Records
CC BY 4.0 Open Data
Open Institutional Datasets (CSV / JSON) →
Download desk-compiled quantitative series & schemas.
2026 Reference Matrix
2026 Institutional Benchmarks & Thresholds →
Statutory capital, clearing, margin & rate conventions.
Editorial Records
Authors & Review Records →
View named contributors where those records are available.
Complete Index
Master Research & Dossier Archive →
Browse all published briefings by topic pillar & date.