
Pull-to-Par Horizon Return, Reinvestment Yield & Macaulay Duration Gap Math
Realized compound bond return equals initial Yield-to-Maturity ONLY when holding horizon H matches Macaulay Duration; the Duration Gap (H - D_Mac) determines whether rising rates boost or hurt terminal wealth.
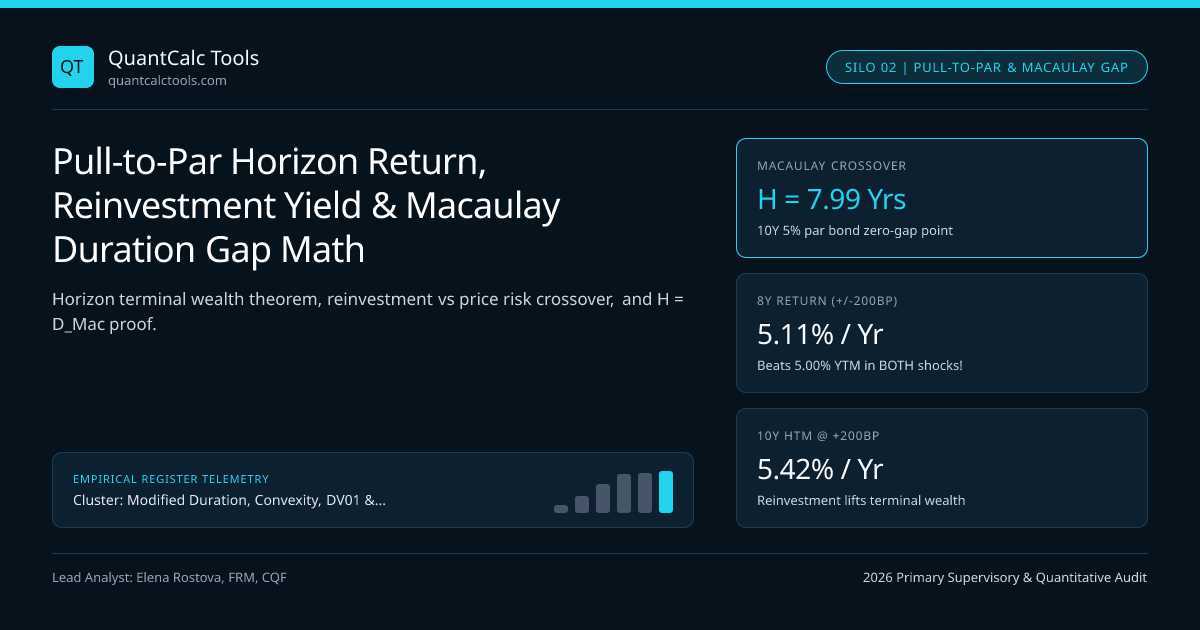
Ask ten retail investors what compound annual return they earn if they buy a 10-year $5.00\%$ bond at par ($YTM = 5.00\%$), rates drop immediately to $2.50\%$, and they hold the bond all the way to Year-10 maturity (Pull to Par = 100.00). Nine out of ten answer "$5.00\%$!"—and all nine are wrong! Because every semiannual $$2.50$ coupon must be reinvested at $2.50\%$ rather than $5.00\%$, realized 10-year CAGR drops to $4.48\%$ (-52 bps/yr reinvestment drag)! Conversely, what happens if rates surge to $7.50\%$ and you sell at Year 3 vs Year 8 vs Year 10? The exact turning point is Frederick Macaulay's (1938) Duration Gap ($Gap = H - D_{\text{Mac}}$)! Anchor Macaulay Duration, Modified Duration & Second-Order Convexity in our Modified Duration, Convexity & DV01 master guide.
Exact Proof of the Horizon Terminal Wealth & Duration Gap Theorem#
Buy a bond today for $P0(y0)$ and hold it over investment horizon $H$ years after an instantaneous parallel shift from $y0$ to $y1 = y0 + \Delta y$. At horizon $H$, **Total Terminal Wealth $WH(y1)$ equals the sum of Compounded Reinvested Past Coupons ($ti \le H$) PLUS the Sale Price of Remaining Future Cashflows ($ti > H$)**—which equals present value $P0(y1)$ compounded forward by $(1 + y1/k)^{kH}$! $$WH(y1) = P0(y1)\left(1 + \frac{y1}{k}\right)^{kH} \implies \frac{\partial \ln WH}{\partial y1}\Bigg|{y1 = y0} = \frac{H - D{\text{Mac}}(y0)}{1 + y0/k} = \mathbf{D{\text{Gap,mod}}}$$ Look at that jewel of financial mathematics (d ln W_H / dy_1 = (H - D_Mac) / (1 + y/k)):
- Short Horizon ($H < D_{\text{Mac}}$, Negative Duration Gap): Price drop dominates reinvestment gain—rising yields HURT realized CAGR!
- Exact Macaulay Horizon ($H = D_{\text{Mac}}$, Zero Duration Gap): First-order price loss and coupon reinvestment gain CANCEL OUT IDENTICALLY ($WH(y1) \ge WH(y0)$ for both hikes and cuts thanks to positive convexity)!
- Long Horizon ($H > D{\text{Mac}}$, Positive Duration Gap — including Hold-to-Maturity $H = M > D{\text{Mac}}$!): Coupon reinvestment dominates—rising yields INCREASE realized terminal CAGR, and falling yields REDUCE realized CAGR!
Worked 10-Year $5.00\%$ Par Bond Horizon CAGR Audit Across $H = 3\text{Y}, 7.99\text{Y}, 10\text{Y}$#
- Initial Metrics: P0 = 100.0000; Macaulay Duration DMac = 7.9894 years (~8.00 yrs); Modified D_mod = 7.7946 yrs
- Instantaneous Rate Shock Immediately After Purchase: Scenario UP (y1 = 7.00%, +200bp) vs DOWN (y1 = 3.00%, -200bp)
- 1) Short 3-Year Horizon (H = 3.00 yrs < D_Mac = 7.99 yrs -> Duration Gap = -4.99 yrs, Price Risk Dominates!):
- Rates Unchanged (5.00%): W_3 = $115,969,342 => Realized 3Y Semiannual Return = 5.000%
- Rates JUMP +200bp (7.00%): Coupons +$16.16M + Sale Price $89.06M = $105.22M => Realized Return = 1.691% (-331 bps!)
- Rates DROP -200bp (3.00%): Coupons +$15.58M + Sale Price $112.56M = $128.14M => Realized Return = 8.442% (+344 bps!)
- 2) Exact Macaulay Horizon (H = 8.00 yrs ~= D_Mac = 7.99 yrs -> Duration Gap ~= 0.00 yrs, IMMUNIZED!):
- Rates Unchanged (5.00%): W_8 = $148,450,562 => Realized 8Y Semiannual Return = 5.000%
- Rates JUMP +200bp (7.00%): Reinvested Coupons $51.40M + 2Y Sale $96.32M = $149.72M => Return = 5.109% (+11 bps HIGHER!)
- Rates DROP -200bp (3.00%): Reinvested Coupons $44.82M + 2Y Sale $103.85M = $149.67M => Return = 5.105% (+11 bps HIGHER!)
- 3) Hold-to-Maturity (H = 10.00 yrs > D_Mac = 7.99 yrs -> Duration Gap = +2.01 yrs, Reinvestment Dominates!):
- Pull-to-Par guarantees Year-10 Principal = $100.00M in ALL scenarios, YET Coupons Compound Differently:
- Rates Unchanged (5.00%): $100M Principal + $63.86M Coupons = $163.86M => Realized Return = 5.000%
- Rates JUMP +200bp (7.00%): $100M Principal + $70.75M Coupons = $170.75M => Realized Return = 5.424% (+42 bps!)
- Rates DROP -200bp (3.00%): $100M Principal + $57.76M Coupons = $157.76M => Realized Return = 4.597% (-40 bps!)
Look at Case 2 (H = 8.00 yrs ~= D_Mac): whether yields spike $+200\text{ bps}$ to $7.00\%$ OR crash $-200\text{ bps}$ to $3.00\%$, 8-year realized annualized return jumps ABOVE $5.00\%$ ($5.11\%$) in BOTH directions! Why? Because at $H = D_{\text{Mac}}$, first-order price and reinvestment risk cancel to zero, leaving pure second-order positive convexity ($+11\text{ bps/yr}$)! Verify compounded annual growth rates interactively in our CAGR calculator.
Constant-Maturity Bond ETFs vs Defined-Maturity Target-Date Ladders#
Why does a perpetual 7–10 Year Treasury ETF behave so differently from holding an individual 10-year Treasury to maturity?
- An individual bond ages every single day: $D{\text{Mac}}$ shrinks from $7.99$ years down to $0.00$ at maturity (
Pull to Par), steadily crossing $H = D{\text{Mac}}$ so an investor with an 8-year horizon eventually recoups 100% of initial rate-hike losses via higher coupon reinvestment! - A constant-maturity bond ETF sells bonds once they age below 7 years and buys fresh 10-year bonds every month—keeping $D{\text{Mac}} \approx 7.8$ years forever! Even in a constant-maturity ETF, however, Leibowitz, Bova & Kogelman (2014) proved that holding the ETF for **roughly $2 D{\text{Mac}} - 1$ years (~14.5 years)** still converges realized return back to new higher yields via continuous portfolio turnover!
Realized Annualized Return Across Holding Horizons ($5.00\%$ 10Y Par Bond)#
| Investor Holding Horizon ($H$) | Duration Gap ($H - D_{\text{Mac}}$) | Dominant Risk Driver | Realized Return ($y \to 3\%$) | Realized Return ($y = 5\%$) | Realized Return ($y \to 7\%$) |
|---|---|---|---|---|---|
| 1-Year Tactical Trade ($H = 1\text{Y}$) | $-6.99\text{ yrs}$ | 93% Price Risk | $+19.86\%$ | $5.00\%$ | $-8.02\%$ |
| 3-Year Intermediate ($H = 3\text{Y}$) | $-4.99\text{ yrs}$ | 78% Price Risk | $+8.44\%$ | $5.00\%$ | $+1.69\%$ |
| 5-Year Medium Term ($H = 5\text{Y}$) | $-2.99\text{ yrs}$ | 55% Price Risk | $+6.26\%$ | $5.00\%$ | $+3.85\%$ |
| 8-Year Macaulay Match ($H = 8\text{Y}$) | $+0.01\text{ yrs}$ | Immunized ($0\%$ Net!) | $+5.11\%$ | $5.00\%$ | $+5.11\%$ |
| 10-Year Hold-to-Maturity ($H = 10\text{Y}$) | $+2.01\text{ yrs}$ | 100% Reinvestment | $+4.60\%$ | $5.00\%$ | $+5.42\%$ |
Unifying Single-Horizon Macaulay Matching with Pension LDI & Zero-Coupon STRIPS#
Want to lock in exact $5.00\%$ realized 10-year CAGR with zero reinvestment uncertainty at $H = 10$ years? Buy a 10-year Zero-Coupon STRIP where $D_{\text{Mac}} = M = 10.00$ years cleanly—see zero-coupon STRIPS quadratic convexity leverage and multi-liability extensions in Redington liability immunization and dispersion. Compare multi-asset wealth platforms in our broker lookup directory and browse the complete Modified Duration & Key-Rate Hedging Topic Hub.
Frequently asked questions
Does Yield-to-Maturity (YTM) assume you MUST hold the bond to maturity AND reinvest all coupons at YTM?
Either holding to Macaulay Duration (H = D_Mac) after a one-time rate shift OR reinvesting every interim coupon at the exact initial YTM while holding to maturity achieves realized return = YTM! Holding to maturity when rates fall fails to achieve YTM because coupons reinvest lower.
What is "Pull to Par" and does it generate extra profit above Yield-to-Maturity on discount bonds?
Pull to Par is the deterministic convergence of a discount bond’s clean price (say 85.00) up to 100.00 as maturity approaches at constant yield. It is NOT "free alpha above YTM"—that annualized capital accretion IS already part of the quoted 5.00% YTM alongside the lower coupon!
Why do target-maturity bond ETFs (like iShares iBonds maturing in Dec 2030) behave differently from aggregate bond ETFs?
Target-maturity ETFs hold only bonds maturing in a single calendar year and liquidate at par in December of that year, so their Macaulay Duration shrinks by ~1 year every year just like an individual bond—unlike constant-duration ETFs that perpetually roll out to new bonds.
What happens if interest rates rise GRADUALLY over 5 years instead of jumping instantaneously on Day 1?
If yields rise gradually rather than immediately on Day 1, early coupons miss out on higher reinvestment rates while remaining duration shrinks; Leibowitz & Bova showed that steady rate rises push the breakeven recovery horizon slightly beyond initial Macaulay Duration.
Publication record
- Published
- 14 November 2026
- Updated
- 14 November 2026
- Author
- Elena Rostova, FRM, CQF
- Review
- Review not recorded
- Automated fact check
- Passed in the stored pipeline record
- Source URLs
- 3 recorded
AI assistance recorded: anthropic/claude-opus-4.6. This field does not establish human review or source verification.
Academic & Institutional Attribution
Cite This Research & Embed Live Data Card
Standard academic & institutional research paper citation format.
Elena Rostova, FRM, CQF. (2026, November 14). Pull-to-Par Horizon Return, Reinvestment Yield & Macaulay Duration Gap Math. QuantCalc Tools. https://quantcalctools.com/guides/pull-to-par-horizon-return-reinvestment-yield-macaulay-gap-mathRelated Bond Duration Convexity Math & Institutional Briefings
Explore Bond Duration Convexity Math Hub (20) →Bond Duration Convexity Math
Modified Duration, Convexity, DV01 & Key-Rate Hedging: 2026 Quantitative GuideBond Duration Convexity Math
Macaulay vs Modified vs Effective Duration: Semiannual & ICMA Yield MathBond Duration Convexity Math
DV01 & PVBP Formula: Why Dirty Invoice Price Scales Dollar DurationBond Duration Convexity Math
Second-Order Bond Convexity Formula: Taylor Error Under Large Yield ShocksBond Duration Convexity Math
Negative Convexity in Callable Bonds & Agency MBS: OAS Finite-Difference MathBond Duration Convexity Math
DV01-Neutral Barbell vs Bullet Portfolio: Convexity Pickup vs Yield MathBond Duration Convexity Math
Key-Rate Duration (KRD) Tent Functions: Partial DV01 Curve Bucketing MathBond Duration Convexity Math
50/50 vs Regression-Weighted 2s5s10s Butterfly Curve Trades: DV01 MathCagr Irr Drawdown Compounding
Arithmetic vs Geometric Mean Return: 0.5*Sigma^2 Variance Drain DerivationCagr Irr Drawdown Compounding
TWRR (CAGR) vs MWRR (XIRR): Irregular Cashflow Timing Divergence MathCagr Irr Drawdown Compounding
XIRR Newton-Raphson Convergence, Descartes Multiple Roots & MIRR MathCagr Irr Drawdown Compounding
Asymmetric Drawdown Recovery Hyperbola & Breakeven Compounding Time Math
QuantCalc Tools Data, Benchmarks & Contributor Records
CC BY 4.0 Open Data
Open Institutional Datasets (CSV / JSON) →
Download desk-compiled quantitative series & schemas.
2026 Reference Matrix
2026 Institutional Benchmarks & Thresholds →
Statutory capital, clearing, margin & rate conventions.
Editorial Records
Authors & Review Records →
View named contributors where those records are available.
Complete Index
Master Research & Dossier Archive →
Browse all published briefings by topic pillar & date.