
Parametric Var Expected Shortfall
Basel III FRTB 97.5% Expected Shortfall: MAR33 Liquidity Horizon Scaling Math
Basel III MAR33.4 replaces uniform 10-day VaR scaling with a nested root-sum-of-squares Expected Shortfall cascade across 10, 20, 40, 60, and 120-day liquidity horizons.
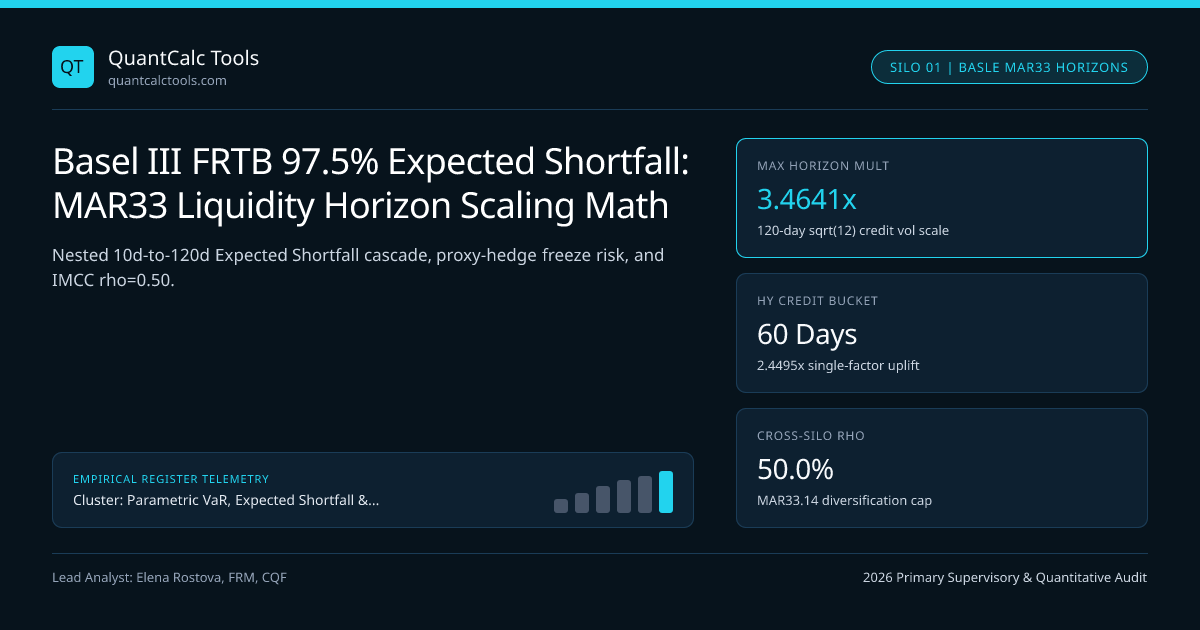
Assuming an investment bank can unwind $2 billion of structured credit correlation swaps in the same 10-day window required to hedge EUR/USD spot was the single costliest flaw of Basel 2.5 internal models during 2008. Under BIS Basel Committee MAR33.4 and MAR33.12, Basel III FRTB 97.5% Expected Shortfall assigns every trading-book risk factor to one of five statutory liquidity horizons—$LH_j \in \{10, 20, 40, 60, 120\}$ business days—and aggregates incremental shocks via a nested root-sum-of-squares cascade rather than computing brute-force 120-day historical returns. Test 10-day base inputs inside our Value at Risk (VaR) calculator and anchor this workflow in our Parametric VaR & Expected Shortfall calibration guide.
The Exact MAR33.4 Nested Cascade Formula#
Why does Basel compute 10-day base Expected Shortfall on progressively restricted factor subsets $P(j)$ instead of taking overlapping 60-day or 120-day return windows? Overlapping 120-day windows inside a 250-day sample leave scarcely two independent observations! Instead, MAR33.4 defines $EST(P)$ as the 10-day 97.5% Expected Shortfall of the full portfolio ($j \ge 1$), and $EST(P, j)$ for $j \in \{2, 3, 4, 5\}$ as the 10-day 97.5% ES computed holding constant all risk factors whose assigned liquidity horizon is shorter than $LH_j$:
$$ES = \sqrt{\big(EST(P)\big)^2 + \sum{j=2}^{5}\left(EST(P, j) \cdot \sqrt{\frac{LHj - LH_{j-1}}{T}}\right)^2}$$
where $T = 10$ days and $(LH1, LH2, LH3, LH4, LH_5) = (10, 20, 40, 60, 120)$, producing exact incremental multipliers of $1.0000$, $\sqrt{2} = 1.4142$, $\sqrt{2} = 1.4142$, and $\sqrt{6} = 2.4495$ for subsets $j = 2, 3, 4, 5$:
Worked Multi-Horizon FRTB MAR33.4 Cascade Calculation ($250M Desk)#
- Base Horizon T = 10 Business Days (97.5% Confidence)
- Subset 10-Day Expected Shortfall Inputs:
- j=1 (LH >= 10d: All factors incl. G10 Rates & Large-Cap EQ) .. ES_10(P,1) = $4,200,000
- j=2 (LH >= 20d: Excludes j=1; keeps IG Credit, Small-Cap EQ) . ES_10(P,2) = $3,100,000
- j=3 (LH >= 40d: Excludes j<=2; keeps EM FX, FX Volatility) ... ES_10(P,3) = $2,400,000
- j=4 (LH >= 60d: Excludes j<=3; keeps HY Credit, Commodity) ... ES_10(P,4) = $1,850,000
- j=5 (LH >= 120d: Excludes j<=4; Credit Vol & Correlation) .... ES_10(P,5) = $1,100,000
- Incremental Horizon Scaling Terms:
- Term 1 (10d base): ($4.20M)^2 * ((10 - 0)/10 = 1.0) = 17.6400 ($M^2)
- Term 2 (10d -> 20d step): ($3.10M)^2 * ((20 - 10)/10 = 1.0) = 9.6100 ($M^2)
- Term 3 (20d -> 40d step): ($2.40M)^2 * ((40 - 20)/10 = 2.0) = 11.5200 ($M^2)
- Term 4 (40d -> 60d step): ($1.85M)^2 * ((60 - 40)/10 = 2.0) = 6.8450 ($M^2)
- Term 5 (60d -> 120d step):($1.10M)^2 * ((120 - 60)/10 = 6.0)= 7.2600 ($M^2)
- Total Liquidity-Adjusted ES = sqrt(17.64 + 9.61 + 11.52 + 6.845 + 7.26)
- = sqrt(52.8750) = $7,271,520 (+73.13% above naive 10d ES!)
Observe a critical risk-management counter-intuition embedded in MAR33.4: hedging an illiquid 60-day high-yield CDS tranche ($j=4$) with a liquid 10-day S&P 500 equity index future ($j=1$) cancels risk only during the first 10 days ($j=1$)! In buckets $j=2, 3, 4$, the equity hedge is frozen out of $P(j)$ because the bank is assumed to liquidate its 10-day hedge on Day 10—or, more precisely, basis mismatch emerges across days 11 to 60 unless the trader dynamically rolls the liquid hedge.
MAR33.12 Statutory Liquidity Horizon Mapping Across Asset Classes#
Under the FRTB-ES-975 2026 Benchmark Standard implemented across EU CRR3 and UK PRA Basel 3.1 rules, supervisors may cap liquidity horizons higher for specific desks, and banks cannot self-assign shorter buckets even if internal turnover appears deep:
Statutory Basel III MAR33.12 Liquidity Horizon Reference Matrix#
| Risk Factor Category (MAR33.12) | Statutory $LH_j$ (Days) | Single-Factor Effective Multiplier $\sqrt{LH_j/10}$ | Incremental Variance Step $(LHj - LH{j-1})/10$ | Related Margin Comparator |
|---|---|---|---|---|
| Specified Interest Rates (USD, EUR, GBP, JPY, AUD, CAD, SEK) & Large-Cap EQ Price | $10$ days | $1.0000\times$ | $1.0$ (Base $T=10$) | ISDA SIMM v2.6 10d MPOR |
| Non-Specified Interest Rates, Small-Cap EQ Price, Large-Cap EQ Vol, IG Sovereign Credit | $20$ days | $1.4142\times$ | $1.0$ | Cleared OTC IRS / CDS |
| FX Volatility, Interest Rate Volatility & Other FX Pairs | $40$ days | $2.0000\times$ | $2.0$ | Bilateral FX Option CSA |
| IG Corporate Credit Spreads (40d), HY Credit Spreads (60d), Energy & Base Metals | $60$ days | $2.4495\times$ | $2.0$ | High-Yield Total Return Swaps |
| Credit Spread Volatility, Structured Correlation & Other Exotic Commodities | $120$ days | $3.4641\times$ | $6.0$ | Bespoke Tranche / NMRF Perimeter |
Notice the third column: if a desk holds only a single 120-day credit volatility factor ($ES{10}(P,1) = \dots = ES{10}(P,5) = E$), the root-sum-of-squares telescopes cleanly to $\sqrt{1 + 1 + 2 + 2 + 6}\,E = \sqrt{12}\,E = 3.4641\,E$, recovering $\sqrt{120/10}$ exactly! Cross-bucket diversification haircuts emerge solely when liquid and illiquid positions offset one another.
Cross-Asset Diversification Cap ($\rho = 0.50$) and IMCC Aggregation#
Even after computing liquidity-adjusted $ES$, MAR33.14 prevents banks from claiming 100% empirical cross-asset correlation benefits across five broad risk classes (Interest Rates, Equity, FX, Commodity, Credit). Every day, the engine must compute one unconstrained $IMCC(C)$ across all classes jointly and five standalone silo values $IMCC(Ck)$ locking out inter-class correlations, blending them via $\rho = 0.50$: $$IMCC = 0.50 \cdot IMCC(C) + 0.50 \cdot \sum{k=1}^5 IMCC(C_k)$$ Combine this calculation with FRTB Stressed ES 12-month crisis calibration and Basel Non-Modellable Risk Factor stress add-ons to produce total IMA market-risk capital. Browse all related formulas on the Parametric VaR & Expected Shortfall Topic Hub.
Frequently asked questions
Why does Basel FRTB scale 10-day Expected Shortfall subsets instead of using actual 60-day or 120-day returns?
A 250-day rolling calibration window contains only two non-overlapping 120-day intervals, making direct 97.5% tail estimation statistically impossible. Computing 10-day ES on progressively frozen factor subsets preserves sample degrees of freedom while penalizing illiquid exit horizons.
Why does proxy-hedging high-yield credit with S&P 500 futures become capital-inefficient under FRTB MAR33?
Large-cap equity futures sit in the 10-day bucket (j=1), whereas high-yield corporate credit spreads sit in the 60-day bucket (j=4). In cascade subsets j=2, 3, and 4, the 10-day equity shock is set to zero, leaving the 60-day credit leg completely unhedged from Day 11 to Day 60.
How does the MAR33.14 rho = 0.50 correlation parameter affect multi-asset trading desks?
Total modellable capital IMCC equals 50% of the fully diversified cross-asset Expected Shortfall plus 50% of the simple sum of standalone Rates, FX, Equity, Credit, and Commodity ES values, capping empirical cross-asset diversification relief at half its theoretical value.
Can a bank assign a 10-day liquidity horizon to corporate bonds if its internal trading volume is high?
No. MAR33.12 establishes statutory floor horizons—40 days for investment-grade corporate credit spreads and 60 days for high-yield corporate credit—and only permits desks or supervisors to increase horizons above those floors, never reduce them.
Publication record
- Published
- 14 November 2026
- Updated
- 14 November 2026
- Author
- Elena Rostova, FRM, CQF
- Review
- Review not recorded
- Automated fact check
- Passed in the stored pipeline record
- Source URLs
- 3 recorded
AI assistance recorded: anthropic/claude-opus-4.6. This field does not establish human review or source verification.
Academic & Institutional Attribution
Cite This Research & Embed Live Data Card
Standard academic & institutional research paper citation format.
Elena Rostova, FRM, CQF. (2026, November 14). Basel III FRTB 97.5% Expected Shortfall: MAR33 Liquidity Horizon Scaling Math. QuantCalc Tools. https://quantcalctools.com/guides/basel-frtb-975-expected-shortfall-liquidity-horizon-bucketingRelated Parametric Var Expected Shortfall & Institutional Briefings
Explore Parametric Var Expected Shortfall Hub (20) →Parametric Var Expected Shortfall
Parametric VaR, Expected Shortfall & Fat-Tail Risk Calibration: 2026 Quantitative GuideParametric Var Expected Shortfall
EWMA Lambda 0.94 vs GARCH(1,1) Volatility Decay: Conditional VaR Math GuideParametric Var Expected Shortfall
Kupiec POF Likelihood Ratio Test: VaR Backtesting & Basel Traffic-Light ZonesParametric Var Expected Shortfall
Christoffersen Markov Independence Test: VaR Clustering & Conditional CoverageParametric Var Expected Shortfall
Square-Root-of-Time VaR Scaling Bias: AR(1) Serial Correlation Math GuideParametric Var Expected Shortfall
Marginal, Incremental & Component VaR: Euler Portfolio Risk Attribution MathParametric Var Expected Shortfall
Delta-Gamma Parametric VaR Formula: Quadratic Taylor Options Convexity MathParametric Var Expected Shortfall
Filtered Historical Simulation (FHS): GARCH Bootstrap VaR & ES Math GuideBond Duration Convexity Math
Negative Convexity in Callable Bonds & Agency MBS: OAS Finite-Difference MathBond Duration Convexity Math
DV01-Neutral Barbell vs Bullet Portfolio: Convexity Pickup vs Yield MathBond Duration Convexity Math
Key-Rate Duration (KRD) Tent Functions: Partial DV01 Curve Bucketing MathBond Duration Convexity Math
50/50 vs Regression-Weighted 2s5s10s Butterfly Curve Trades: DV01 Math
QuantCalc Tools Data, Benchmarks & Contributor Records
CC BY 4.0 Open Data
Open Institutional Datasets (CSV / JSON) →
Download desk-compiled quantitative series & schemas.
2026 Reference Matrix
2026 Institutional Benchmarks & Thresholds →
Statutory capital, clearing, margin & rate conventions.
Editorial Records
Authors & Review Records →
View named contributors where those records are available.
Complete Index
Master Research & Dossier Archive →
Browse all published briefings by topic pillar & date.