
Parametric Var Expected Shortfall
Kupiec POF Likelihood Ratio Test: VaR Backtesting & Basel Traffic-Light Zones
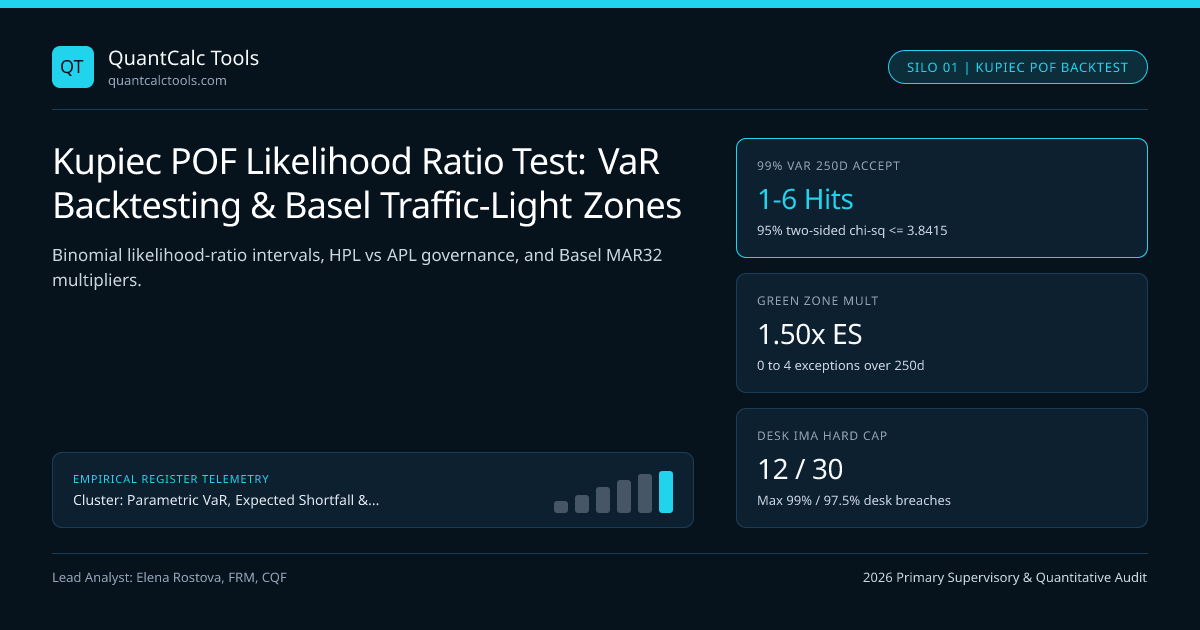
Kupiec’s Proportion of Failures (POF) test evaluates binomial VaR breach counts via a 1-df chi-squared log-likelihood ratio, governing Basel Green, Amber, and Red capital multipliers.
Observing $x = 6$ daily PnL losses exceeding a 99.0% Value-at-Risk forecast over $N = 250$ business days yields a realized breach rate of $2.40\%$—more than double the $p_0 = 1.00\%$ model promise—yet does that represent bad luck or a statistically broken risk engine? Kupiec (1995) answered this question via the Proportion of Failures (POF) unconditional coverage likelihood-ratio test, which underpins both legacy Basel II market-risk add-ons and modern Basel III MAR32 desk-level eligibility gates (where desks must backtest 1-day 99% and 97.5% VaR alongside Basel III FRTB 97.5% Expected Shortfall). Generate daily VaR thresholds in our Value at Risk (VaR) calculator and review the complete model governance stack in our Parametric VaR & Expected Shortfall calibration guide.
Exact Kupiec Log-Likelihood Ratio Formula and Edge-Case Handling#
Let $It = \mathbb{I}{\{\text{PnL}t < -VaR{t,\alpha}\}}$ denote the daily hit indicator over $N$ trading days, with total breaches $x = \sum{t=1}^N It$ and theoretical breach probability $p = 1 - \alpha$ ($p = 0.01$ at 99% VaR; $p = 0.025$ at 97.5% VaR). Under the null hypothesis $H0: \hat{p} = p$, $x \sim \text{Binomial}(N, p)$. Comparing the constrained binomial likelihood at $p$ against the unconstrained MLE $\hat{p} = x/N$ produces $LR{POF} \sim \chi^2(1)$:
$$LR_{POF} = -2\ln\left[\frac{(1-p)^{N-x}\,p^x}{\left(1 - \frac{x}{N}\right)^{N-x}\left(\frac{x}{N}\right)^x}\right]$$
Note the boundary singularity at $x = 0$ (zero exceptions): because $\lim{x \to 0^+} (x/N)^x = 1$, the formula simplifies cleanly to $LR{POF}(x=0) = -2N\ln(1-p)$. At $N = 250$ and $p = 0.01$, $LR{POF}(0) = -500\ln(0.99) = 5.0252 > 3.8415$! In a two-sided academic Kupiec test at 95% confidence ($\chi^2{0.95, 1} = 3.8415$), zero breaches over 250 days rejects the model for being overly conservative! Regulatory traffic-light zones, by contrast, use a one-sided cumulative binomial upper tail because supervisors do not penalize conservative capital buffers—though desks deliberately inflating VaR to pass desk-level MAR32 P&L Attribution (PLAT) tests face separate supervisory scrutiny from the UK PRA and Central Bank of Ireland.
Worked 250-Day Kupiec Log-Likelihood Ratio & Traffic-Light Audit#
- Chi-Squared(1 df) Critical Thresholds: 95% Conf = 3.8415, 99% Conf = 6.6349
- Case A: x = 4 Exceptions (hat_p = 4/250 = 0.0160)
- Log Null Likelihood = 246 * ln(0.99) + 4 * ln(0.01) = -2.47238 - 18.42068 = -20.89306
- Log MLE Likelihood = 246 * ln(0.984) + 4 * ln(0.016) = -3.96786 - 16.54067 = -20.50853
- LR_POF(x = 4) = -2 * (-20.89306 - (-20.50853)) = 0.7691 < 3.8415 (PASS - Green Zone)
- Case B: x = 6 Exceptions (hat_p = 6/250 = 0.0240)
- Log Null Likelihood = 244 * ln(0.99) + 6 * ln(0.01) = -2.45228 - 27.63102 = -30.08330
- Log MLE Likelihood = 244 * ln(0.976) + 6 * ln(0.024) = -5.92772 - 22.37821 = -28.30593
- LR_POF(x = 6) = -2 * (-30.08330 - (-28.30593)) = 3.5547 < 3.8415 (Borderline Two-Sided; Amber Zone!)
- Case C: x = 7 Exceptions (hat_p = 7/250 = 0.0280)
- LR_POF(x = 7) = 5.4974 > 3.8415 (REJECTS H0 at 95% confidence!)
Basel III MAR32 Bank-Wide Multiplier Schedule and Desk-Level Thresholds#
Under modern Basel III FRTB (MAR32.9 and MAR33.41), backtesting operates on two distinct tiers using Actual P&L (APL) and Hypothetical P&L (HPL) (the PnL that would have occurred if yesterday's positions were held unchanged for 24 hours without intraday trading):
- Bank-Wide Capital Multiplier ($m_c \ge 1.50$): Determined by the maximum of APL breaches or HPL breaches against 1-day 99.0% VaR over 250 days.
- Trading Desk Eligibility Gate (MAR32.19): An individual trading desk loses Internal Models Approach (IMA) approval and reverts to the punitive Standardized Approach if over 250 days it suffers more than 12 exceptions at 99.0% VaR OR more than 30 exceptions at 97.5% VaR!
Basel MAR32 Backtesting Exception Zones & Capital Plus-Factor Schedule#
| 250-Day 99% VaR Breaches ($x$) | Cumulative Binomial Prob $\Pr(X \le x-1)$ | Kupiec Two-Sided $LR_{POF}$ | Basel Traffic-Light Zone | FRTB ES Capital Multiplier ($m_c$) |
|---|---|---|---|---|
| $0$ to $4$ Breaches | $0.00\%$ to $89.22\%$ | $5.03$ ($x=0$) down to $0.77$ ($x=4$) | Green Zone | $1.50\times$ (Minimum statutory floor) |
| $5$ Breaches | $89.22\%$ (Type I error $10.78\%$) | $1.9568$ | Amber Zone (Tier 1) | $1.70\times$ ($+13.3\%$ capital add-on) |
| $6$ Breaches | $95.88\%$ | $3.5547$ | Amber Zone (Tier 2) | $1.76\times$ ($+17.3\%$ capital add-on) |
| $7$ to $8$ Breaches | $98.58\%$ to $99.58\%$ | $5.4974$ to $7.7346$ | Amber Zone (Tier 3–4) | $1.83\times$ ($x=7$) / $1.88\times$ ($x=8$) |
| $9$ Breaches | $99.89\%$ | $10.2287$ | Amber Zone (Tier 5) | $1.92\times$ ($+28.0\%$ capital add-on) |
| $\ge 10$ Breaches | $\ge 99.97\%$ | $\ge 12.9502$ | Red Zone | $2.00\times$ + Mandatory Model Review |
The Low-Power Blind Spot of Kupiec POF (And How to Fix It)#
Examine the fourth metric card above: if a faulty risk engine secretly suffers a true 2.0% daily breach rate (twice the allowed 1.0% probability!), the probability of observing $x \ge 7$ breaches over $N = 250$ days is only $23.5\%$, and even observing $x \ge 5$ (Amber Zone) occurs just $55.9\%$ of the time! Worse, Kupiec POF depends exclusively on the scalar sum $x$ and ignores when breaches happen: four exceptions on Tuesday, Wednesday, Thursday, and Friday of a liquidity crisis produce the exact same $LR_{POF} = 0.7691$ Green Zone pass as one isolated breach per quarter! Always pair Kupiec POF with Christoffersen Markov independence testing and Acerbi-Szekely Expected Shortfall Z2 backtesting, and browse all validation methods on the Parametric VaR & Expected Shortfall Topic Hub.
Frequently asked questions
Why does zero VaR breaches over 250 days fail a two-sided Kupiec POF test at 99% confidence?
At p = 0.01 and N = 250, the probability of observing zero breaches is 0.99^250 = 8.11%, and the log-likelihood ratio equals -500 * ln(0.99) = 5.0252, exceeding the 95% chi-squared critical value of 3.8415 because the model overstates risk.
What is the difference between Hypothetical P&L (HPL) and Actual P&L (APL) in MAR32 backtesting?
Hypothetical P&L revalues yesterday’s exact end-of-day portfolio using today’s market closes without intraday trades, isolating pure risk-model accuracy. Actual P&L includes intraday execution PnL while excluding fees, commissions, and bid-ask spreads.
Why did Basel III FRTB add 97.5% VaR backtesting alongside 99.0% VaR at the trading-desk level?
At 99.0% VaR over 250 days, only 2.5 exceptions are expected, giving Kupiec low statistical power to catch miscalibrated tails. Adding 97.5% VaR raises expected breaches to 6.25 (with a hard cap of 30 exceptions), sharpening model discrimination.
Does passing the Kupiec POF test prove a parametric VaR model is well calibrated?
No. Kupiec POF checks only total breach count and ignores both volatility clustering (consecutive daily breaches) and the dollar magnitude of losses on breach days, requiring Christoffersen independence and Acerbi-Szekely ES tests.
Publication record
- Published
- 14 November 2026
- Updated
- 14 November 2026
- Author
- Elena Rostova, FRM, CQF
- Review
- Review not recorded
- Automated fact check
- Passed in the stored pipeline record
- Source URLs
- 3 recorded
AI assistance recorded: anthropic/claude-opus-4.6. This field does not establish human review or source verification.
Academic & Institutional Attribution
Cite This Research & Embed Live Data Card
Standard academic & institutional research paper citation format.
Elena Rostova, FRM, CQF. (2026, November 14). Kupiec POF Likelihood Ratio Test: VaR Backtesting & Basel Traffic-Light Zones. QuantCalc Tools. https://quantcalctools.com/guides/kupiec-pof-likelihood-ratio-var-exception-backtesting-zonesRelated Parametric Var Expected Shortfall & Institutional Briefings
Explore Parametric Var Expected Shortfall Hub (20) →Parametric Var Expected Shortfall
Parametric VaR, Expected Shortfall & Fat-Tail Risk Calibration: 2026 Quantitative GuideParametric Var Expected Shortfall
Christoffersen Markov Independence Test: VaR Clustering & Conditional CoverageParametric Var Expected Shortfall
Square-Root-of-Time VaR Scaling Bias: AR(1) Serial Correlation Math GuideParametric Var Expected Shortfall
Marginal, Incremental & Component VaR: Euler Portfolio Risk Attribution MathParametric Var Expected Shortfall
Delta-Gamma Parametric VaR Formula: Quadratic Taylor Options Convexity MathParametric Var Expected Shortfall
Filtered Historical Simulation (FHS): GARCH Bootstrap VaR & ES Math GuideParametric Var Expected Shortfall
Extreme Value Theory (EVT) Peaks-Over-Threshold: GPD VaR & ES Formula GuideParametric Var Expected Shortfall
Cholesky Factorization in Monte Carlo VaR: Fixing Broken Correlation GridsBond Duration Convexity Math
Key-Rate Duration (KRD) Tent Functions: Partial DV01 Curve Bucketing MathBond Duration Convexity Math
50/50 vs Regression-Weighted 2s5s10s Butterfly Curve Trades: DV01 MathBond Duration Convexity Math
Cheapest-to-Deliver (CTD) Treasury Futures Conversion Factor & DV01 MathBond Duration Convexity Math
Leveraged Treasury Repo Carry, Curve Rolldown & Breakeven Yield Spike Math
QuantCalc Tools Data, Benchmarks & Contributor Records
CC BY 4.0 Open Data
Open Institutional Datasets (CSV / JSON) →
Download desk-compiled quantitative series & schemas.
2026 Reference Matrix
2026 Institutional Benchmarks & Thresholds →
Statutory capital, clearing, margin & rate conventions.
Editorial Records
Authors & Review Records →
View named contributors where those records are available.
Complete Index
Master Research & Dossier Archive →
Browse all published briefings by topic pillar & date.